The biggest pain point when debugging an application on the nRF51 series is the inability to set breakpoints while the SoftDevice is active without triggering an assert. Although a workaround exists that allows the debugging process to limp along for a short amount of time after the SoftDevice complains, using breakpoints with the nRF51 is inevitably a disruptive process.
Thankfully, the nRF52 series includes support for a neat feature called Monitor Mode Debugging. When this feature is enabled, the processor will trigger a specific interrupt handler (DebugMon_Handler) instead of halting when a breakpoint is reached. This DebugMon_Handler then spins and executes some 'monitor' code until the debugger wishes to continue. Because the DebugMon_Handler is running in an interrupt context, it effectively halts the execution of all code except for code that runs in higher-priority contexts. The monitor code itself allows the debug probe (e.g. Segger J-Link) to maintain communication with the processor without actually halting it.
In short, using monitor mode instead of halt mode with the nRF52 allows the debugger to set breakpoints in low-priority contexts and perform normal debugging operations without impeding higher-priority code like the SoftDevice's time-critical routines.
Prereqs
Monitor mode debugging requires support in the processor (in this case a Cortex-M4F) as well as in the debug probe (in this case a J-Link). As long as the processor and debug probe are correctly configured no further cooperation is required from the debugger: this means that the GDB client and therefore Eclipse can use monitor mode without any specific support for it. Adding monitor mode support to a GDB/Eclipse project is straightfoward as long as the following requirements are met:
- S132 v2 or newer
- Segger J-Link drivers v5.10r or newer
- J-Link PLUS, ULTRA+, or PRO
NOTE: The J-Link OB that is included on Nordic development kits does not include a license for monitor mode debugging. On Windows machines, the J-Link driver will allow evaluation of the monitor mode debugging feature if the user accepts a license pop-up. On Linux and OSX machines, the J-Link driver will accept the commands to enable monitor mode debugging but will silently fail to enable it.
Procedure
Segger supplies DebugMon_Handler code for several compilers. The files needed for using GDB/Eclipse are available in the 'Sample project' here. After downloading:
- Create a new dir e.g. '{SDK13_ROOT}/external/jlink_monitor_mode_debug/gcc'
- Copy 'JLINK_MONITOR.c', 'JLINK_MONITOR.h', and 'JLINK_MONITOR_ISR_SES.s' from the 'Sample project' to the new dir
These files need to be compiled into the application so the default DebugMon_Handler is replaced by Segger's implementation. Regardless of whether GDB or Eclipse is being used, the fastest way to get started is to simply add these files to an existing Makefile. For a typical example in SDK13 this might involve copy-and-pasting the following to a line just above the 'default:' target:
ifeq ($(MMD), 1)
CFLAGS += -O0 -ggdb -DDEBUG -DDEBUG_NRF
CFLAGS += -DMMD
ASMFLAGS += -mcpu=cortex-m4
ASMFLAGS += -mthumb
SRC_FILES += $(SDK_ROOT)/external/jlink_monitor_mode_debug/gcc/JLINK_MONITOR.c
SRC_FILES += $(SDK_ROOT)/external/jlink_monitor_mode_debug/gcc/JLINK_MONITOR_ISR_SES.s
INC_FOLDERS += $(SDK_ROOT)/external/jlink_monitor_mode_debug/gcc
$(info Building for monitor debug mode.)
endif

ifeq ($(HALT), 1)
CFLAGS += -O0 -ggdb -DDEBUG -DDEBUG_NRF
$(info Building for halt debug mode.)
endif

ifeq ($(RELEASE), 1)
CFLAGS += -O3 -g3
ASMFLAGS += -g3
$(info Building for release.)
endif
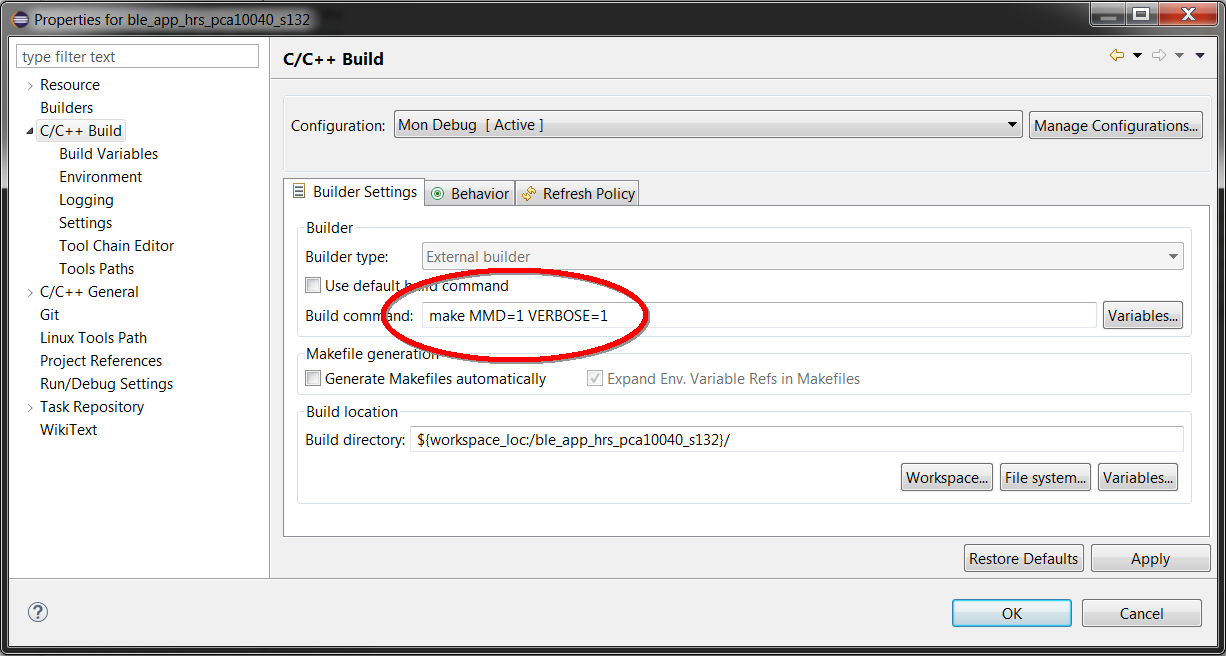
Then, calling make clean followed by make MMD=1 will cause these files to included in the build. From Eclipse, calling make MMD=1 can be accomplished by modifying the existing 'Build Configuration' (or creating a new one):

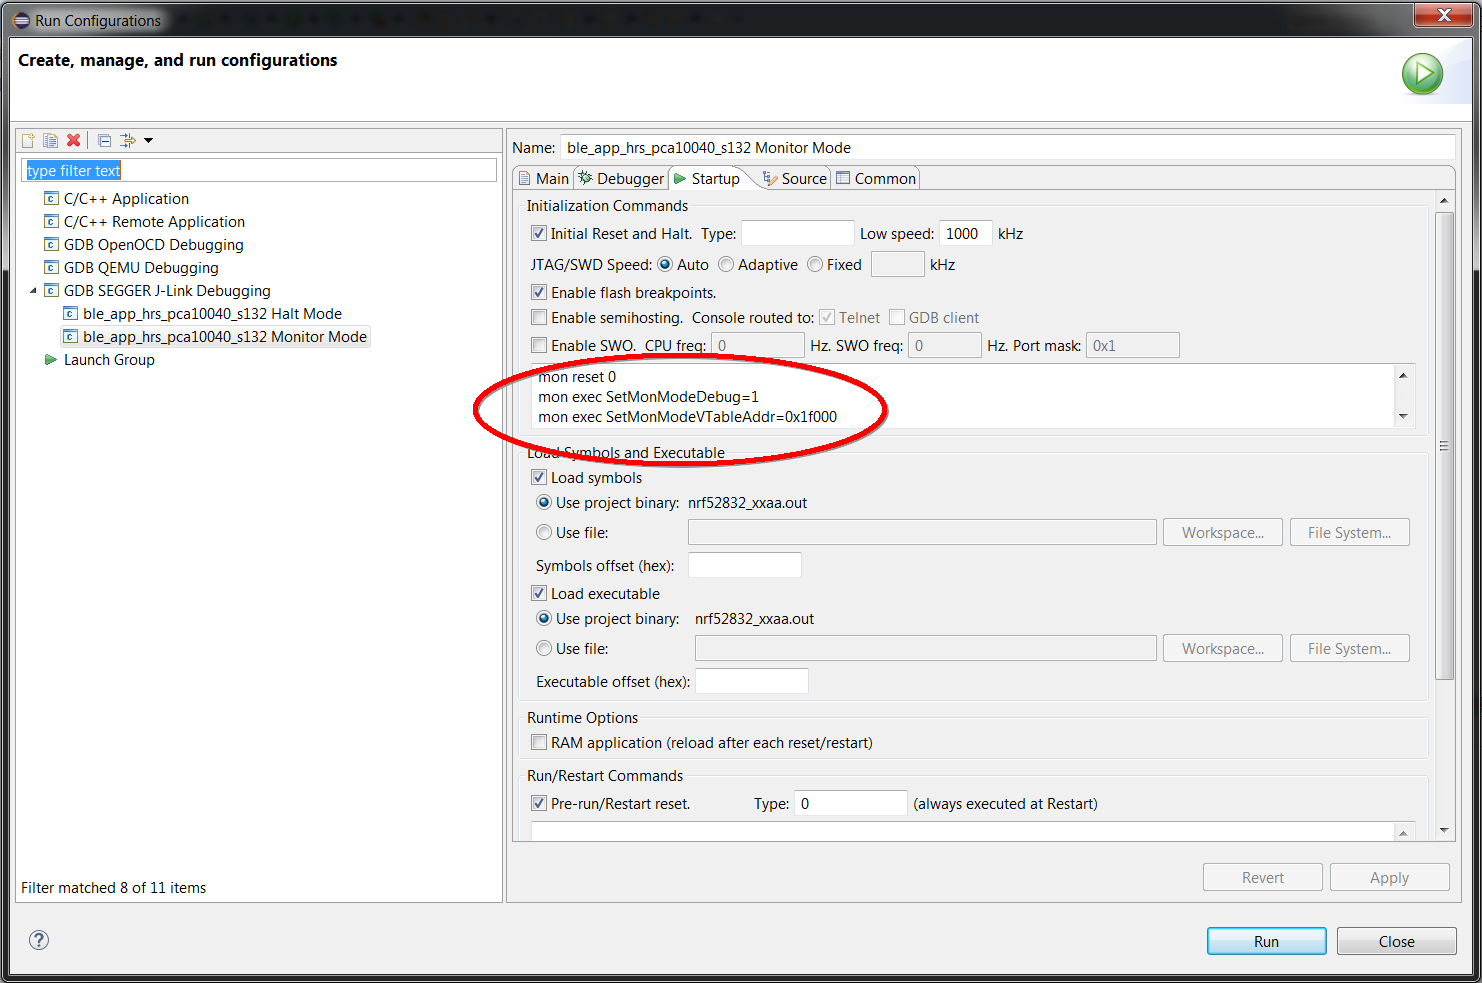
Next, two commands are required to be executed by JLinkGDBServerCL to enable monitor mode debugging:
mon exec SetMonModeDebug=1
mon exec SetMonModeVTableAddr=0x1f000
The second command tells the J-Link where the application's vector table is located. This location varies between versions of a particular SoftDevice. The easiest way to locate it is to check a project's linker file. For example, in the ble_app_uart project in SDK13 the 'ble_app_uart_gcc_nrf52.ld' defines this offset as 0x1f000:
MEMORY
{
  FLASH (rx) : ORIGIN = 0x1f000, LENGTH = 0x61000
  RAM (rwx) :  ORIGIN = 0x200025f8, LENGTH = 0xda08
}
These two commands can be added to a command script or gdbinit file if GDB is being invoked directly from a Makefile:
.PHONY: gdb_cmd_file
gdb_cmd_file: default
    @echo "target remote localhost:$(GDB_PORT)" > $(GDB_CMD_PATH)
    @echo "mon speed 10000" >> $(GDB_CMD_PATH)
    @echo "mon flash download=1" >> $(GDB_CMD_PATH)
    @echo "load $(DBG_BUILD_DIR)/$(PROJECT_NAME).out" >> $(GDB_CMD_PATH)
    @echo "break main" >> $(GDB_CMD_PATH)
    @echo "mon reset 0" >> $(GDB_CMD_PATH)
    @echo "mon exec SetMonModeDebug=1" >> $(GDB_CMD_PATH)
    @echo "mon exec SetMonModeVTableAddr=0x1f000" >> $(GDB_CMD_PATH)
If GDB is being launched by Eclipse then these commands can be appended to the commands under the 'Startup' tab in the project's 'Debug Configuration':

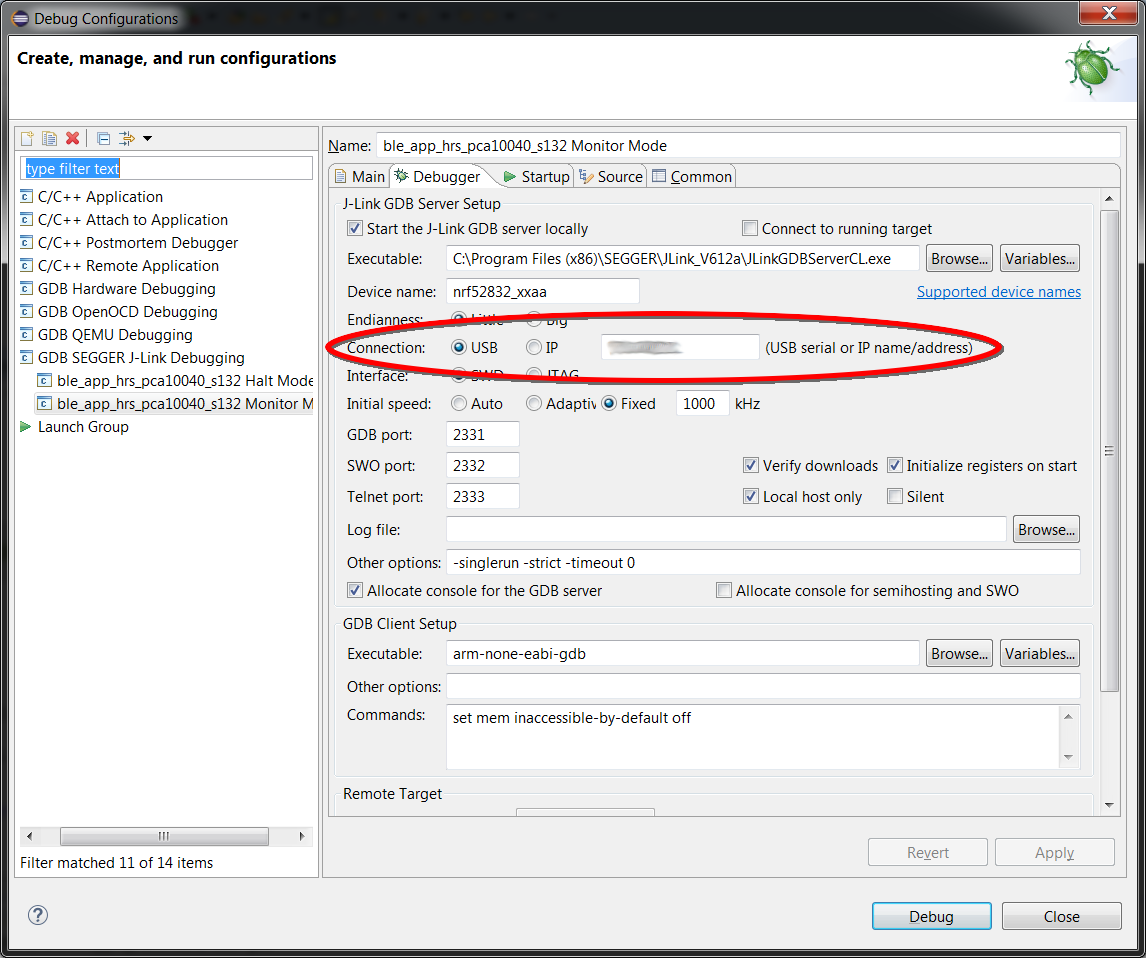
No other changes are required but if a standalone debug probe is used (i.e. a fancy J-Link) then the correct debug probe should be selected by entering its serial number in the 'Debugger' tab:

Note that a second 'Debug Configuration' can be created that omits these two commands to allow for switching between halt mode and monitor mode debugging. Care should be taken to ensure that the correct 'Build Configuration' was used to build the application before starting the debugger in monitor mode because the JLinkGDBServerCL has no way to ensure that the application was built with a valid DebugMon_Handler.
A proper Makefile for switching between halt debugging, monitor debugging, and release builds is provided for the ble_app_uart project in SDK13 here.
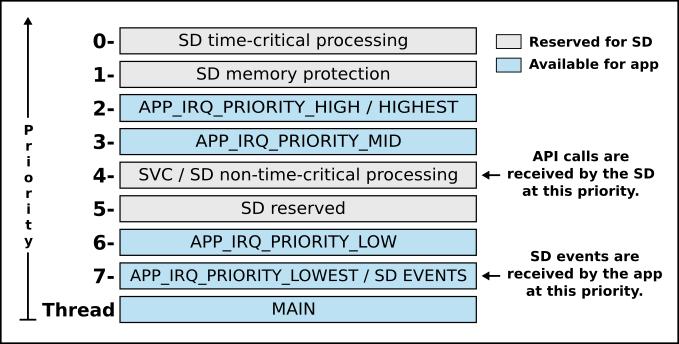
Finally, the application needs to assign a reasonable priority to the DebugMon_Handler. This can be done at the top of the main function in 'main.c' with a call to NVIC_SetPriority(DebugMonitor_IRQn, 7UL);. Priority level 7 allows for setting breakpoints in code that executes in the Thread (or main) context. For reference, here is list of the interrupt priorities that are use by the S132:

The priority level that is assigned to the DebugMon_Handler should be set to one level higher than the code that needs to be debugged. However, setting the DebugMon_Handler priority to level 0, 1, 2, 3, or 4 can lead to interference with the operation of the SoftDevice. Using priority level 6 allows breakpoints to be set in the on_ble_evt function and is the recommended level for most applications.
The JLinkGDBServerCL takes care of writing the required processor registers to enable monitor mode debugging. Note that if the application triggers a soft reset then there can be a brief window between when the processor resets and when the J-Link can write the registers to reenable monitor mode.


Top Comments