Programming and debugging the nRF5x on our Developments kits is straight forward. Doing the same when you are using other boards might not be so easy. In this blog post we will explain which components are needed in order to program and debug a nRF5x chip.
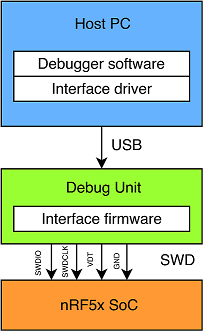
The nRF chip is connected to a Debug unit through an interface called "Serial Wire Debug", or "SWD" for short. The debug unit acts as a bridge between the chip and your PC. It communicates with the programming and debugging software on your PC through a “Debug interface”. Your PC must have a driver for the debug unit and debug interface you are using. The driver allows your PC to recognize the debug unit, and allows communication between them over USB.
When developing applications on a nRF5x Development Kit, you can program it by simply connecting it to your PC with a USB cable. This is possible because the Development Kit has an on-board debug unit supporting the JLINK debug interface.
Since the on-board debug unit is able to program and debug the on-board chip, it is also able to program any other nRF5x chip. The Development Kit has headers where you can access the Serial Wire Debug pins. The video below describes how connect these headers to a custom board. You can also see section 5.1 of the nRF51 User Guide for more information about the debug out headers.
If you do not have a nRF5x Development Kit, you can always use a dedicated debug adapter. There exist several manufacturers and debug interfaces. With the nRF5x series, it is common to use JLINK debug adapters from Segger. You can also use debug units using other debug interfaces like the CMSIS-DAP interface, as long as you have the proper drivers and software on your PC. If you are having any problems, stop by our Developer Zone forum or support portal, where my colleagues and I will do our best to help you out.