Visualising your memory usage

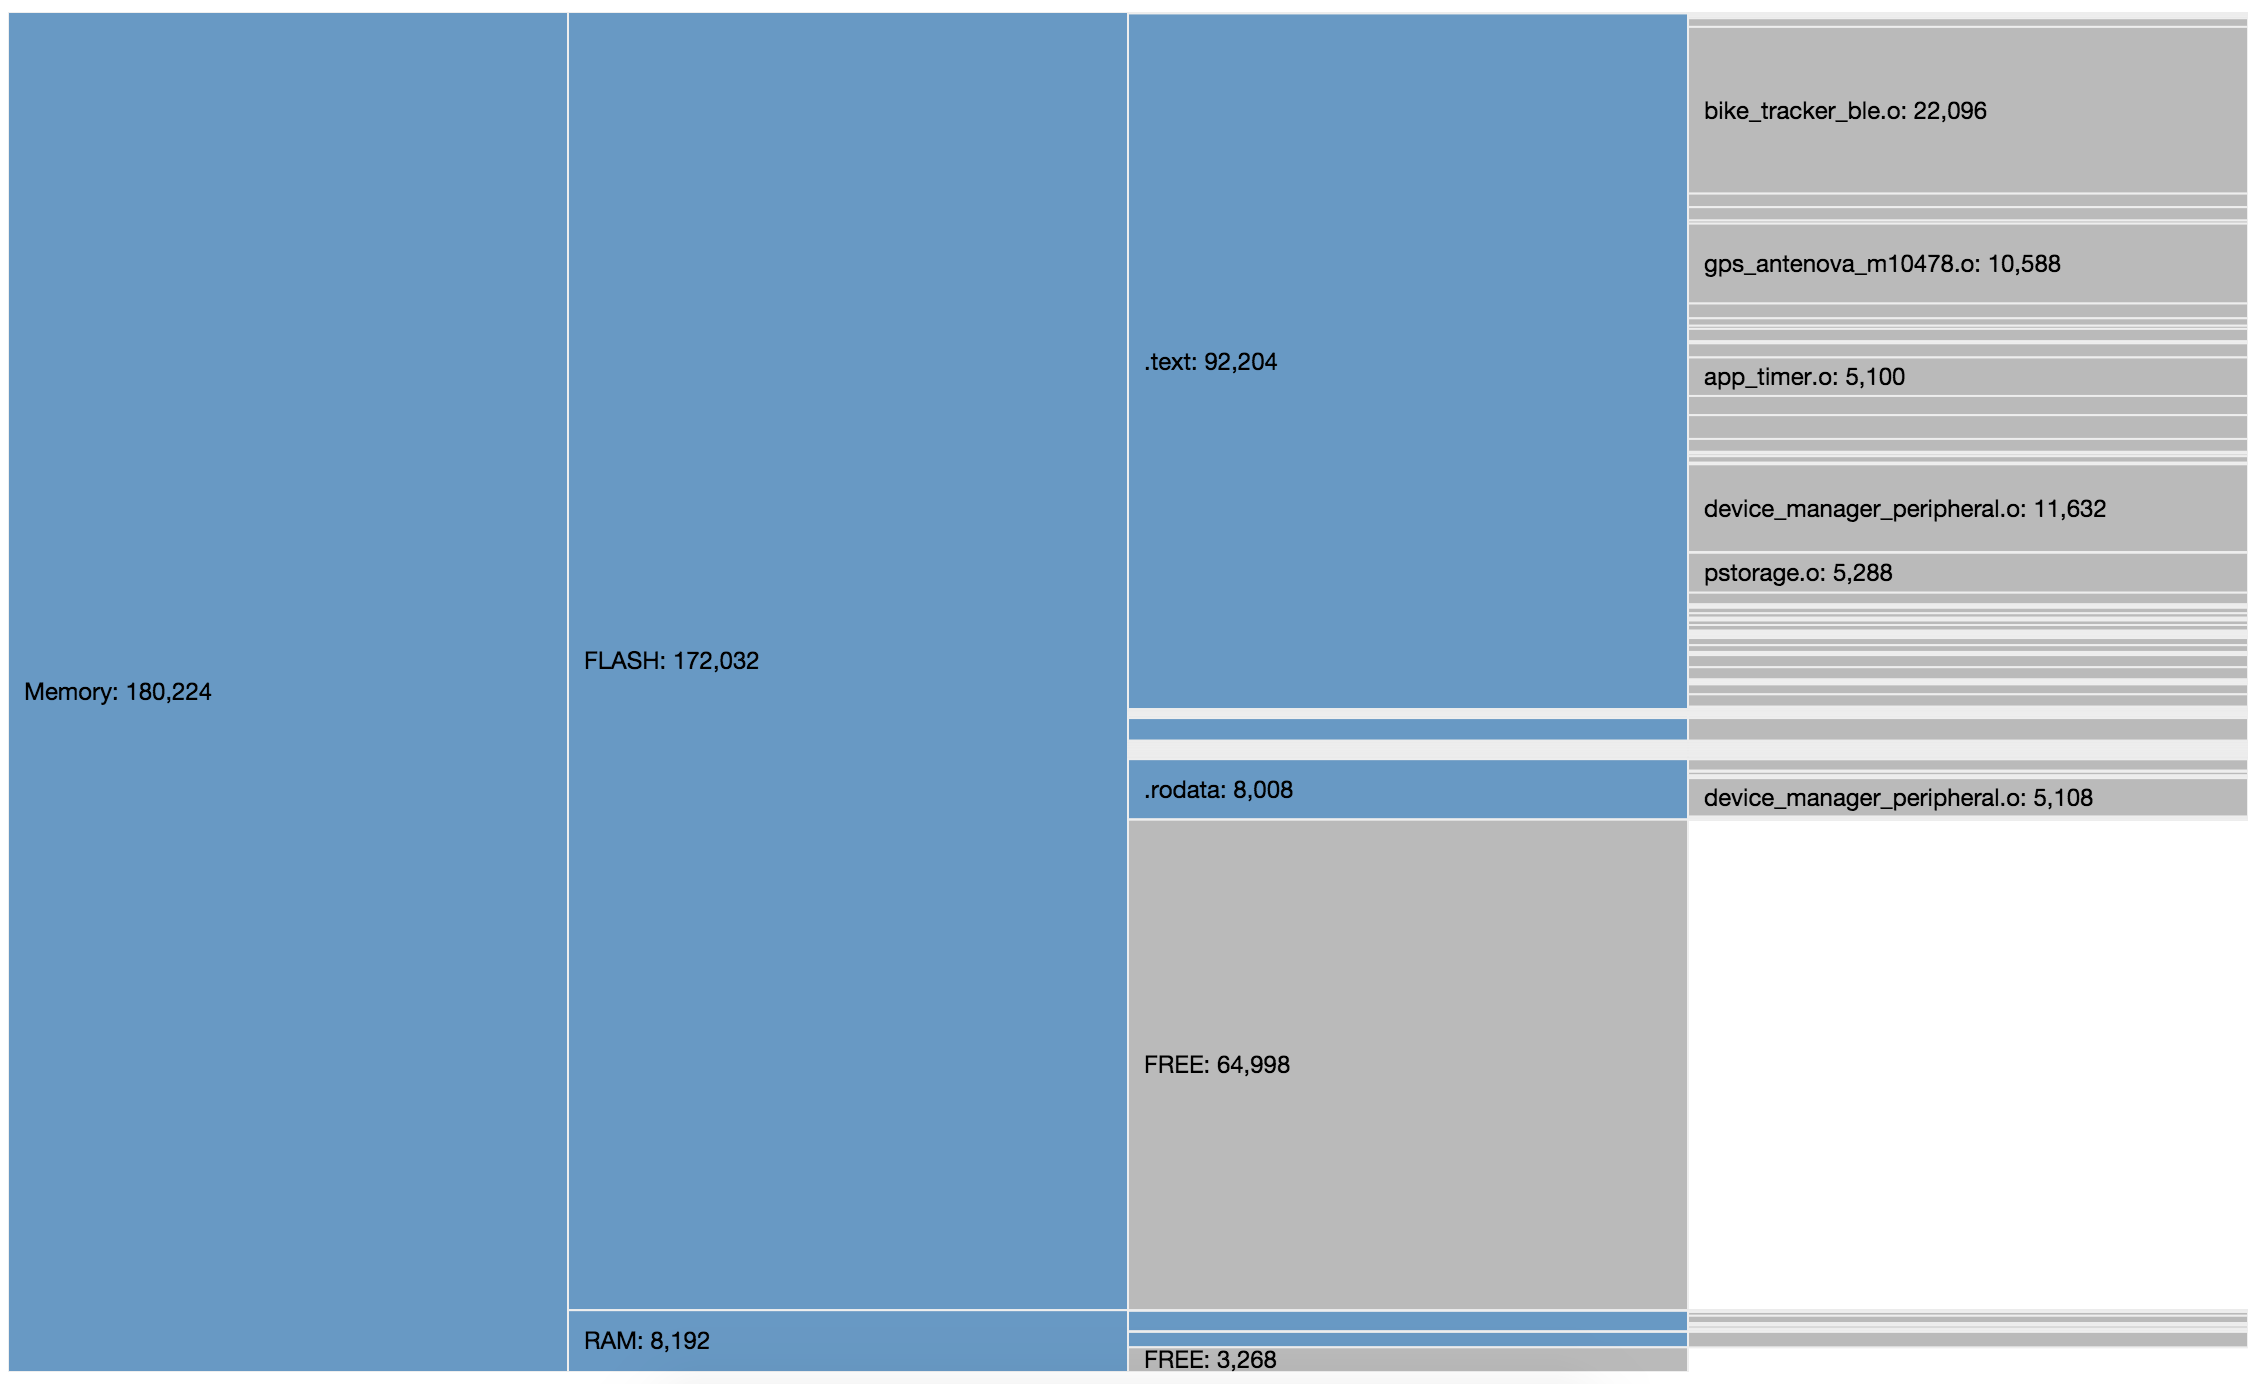
The linker in the GCC toolchain, ld, produces a *.Map file which shows you how the memory on your micro is being used. This file is a goldmine of information but it's a bit difficult for humans to absorb.

I've whipped up a web page which uses the excellent D3.js library to draw a visualisation of your memory usage, using the *.Map file as input. Blocks of memory are drawn proportionally so it's easy to see how much memory you have left and where it's all being used. Click on a block to zoom in on it.

You can run the tool right off the github project page, or download it and modify it for your needs. Pull requests welcome.

https://github.com/eliotstock/memory

image description

Cheers,

Eliot

Parents
  • Ah, you are right. If I join the lines together with .text in them:

    ex -c '%g/\.text/j' -c "wq" prog.map
    

    then I get a lot more info. A better one would be the one that leaves alone the lines that are already on one line:

    ex -c '%g/\.text\S*[\s]*$/j' -c "wq" prog.map
    

    And succeeded by replacing .text.blah with .text:

    sed -i 's/\.text\S*/.text/g' prog.map
    

    The only thing left is that the items get really small when you're program gets big. I've to look in the zooming options in your code, but thanks again!

Comment
  • Ah, you are right. If I join the lines together with .text in them:

    ex -c '%g/\.text/j' -c "wq" prog.map
    

    then I get a lot more info. A better one would be the one that leaves alone the lines that are already on one line:

    ex -c '%g/\.text\S*[\s]*$/j' -c "wq" prog.map
    

    And succeeded by replacing .text.blah with .text:

    sed -i 's/\.text\S*/.text/g' prog.map
    

    The only thing left is that the items get really small when you're program gets big. I've to look in the zooming options in your code, but thanks again!

Children
No Data