Many developers might be familiar with the problems that may arise when wanting to measure current consumption, especially with applications using from a couple of µA to some mA. You most probably have to have some very expensive equipment that takes up quite a lot of space on your desktop. This often means that it is stowed away at a lab, or actually too expensive to buy. Since we have created the nRF52 Online Power Profiler, this can solve some issues, but what if the application has forgotten to turn off unnecessary power consumers, has wrong intervals between events or is sampling the ADC more than needed?
Usually, a developer uses most of his or her time in front of a computer, and when finalizing the product, walks into a lab where the large, expensive equipment is kept. At this time in the development phase, it’s often too late to take care of the power consuming bugs discovered. The architecture of the software may not support the needed fixes, or there is simply no time left to take the necessary actions.
To solve this, we wanted a tool that is both small, fairly priced and able to measure the lowest of sleep currents in typical Bluetooth Low Energy applications. A tool that can be used continuously by the developer without taking up unnecessary space at the desk. The Power Profiler Kit does exactly that! We at Nordic’s application group have twisted our brains to bring forth a tool that meets a middle ground between physical size, accuracy and price.
The User Guide explains all the details, but I want to elaborate a bit about how the PPK will help developers in their day to day job. Let’s start by looking at the simplest setup for using the PPK.
Typical Setup
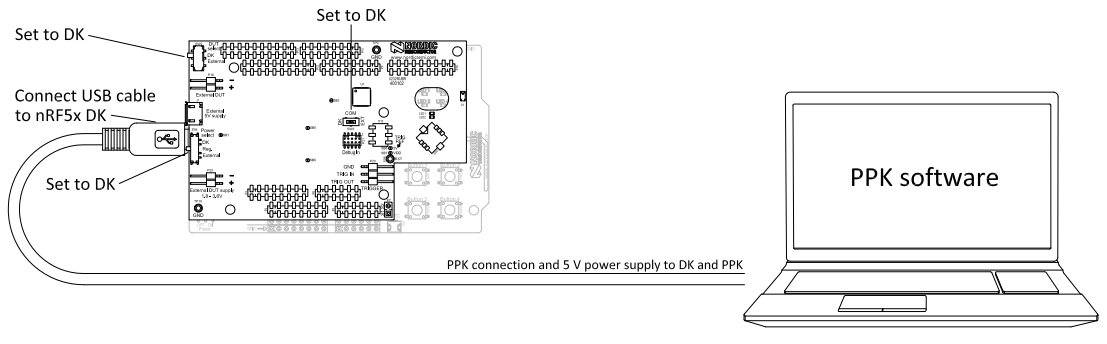
The PPK plugs directly on top of our nRF51 and nRF52 development kits to get you quickly measuring the application you have already developed. There are some switches on the PPK to take notice of, especially the DUT select and Power select. The PPK is able to power and measure any external application or directly measure the DK, so for this example you should set this to DK. The Power select switch allows for using either power from the DK, on board regulator or any external source. When using the regulator, the voltage can be adjusted by the software from 1.8V to 3.6V. This is great for analyzing different source voltages, but when measuring the applications running on the DK, the switch should be set to DK to avoid any leakage currents caused by the on board debugger.
When everything is set up according to the user guide, you can start the software. The software will first do a small calibration routine before giving you control over all functions. The PPK will then meet the user with this interface:
![]()
Measurement examples
KeySight N6705B
To give an example of how much detail you can expect to see from the application, I have here connected an nRF Beacon. First to a Keysight N6705B that we often use for characterization of our applications, and then to the external DUT connector of the PPK. Both setups are powering the DUT (device under test) with 3V.
![]()
Here we measure over 10 seconds and read an average current consumption of 33.484µA.
To measure the sleep current, we simply zoom in and place the measurement markers in an area where the nRF51 is idle.
![]()
With instruments like these, we have the possibility to inspect the radio events, look at the ramp up time, preprocessing etc. Here we catch the radio event by setting the instrument to trigger on the rising edge at a couple of milliamps.
![]()
This is often useful, since we can measure how long time the radio is active and for example if we have both TX or RX events (like in the beacon case, we only have TX).
The Power Profiler Kit
Now, let’s try the exact same device on the PPK. To do this, we simply plug it in to the external DUT connector, and set the Select DUT switch to External. The on board regulator is used as power source, to set the voltage to exactly 3V as with the Keysight instrument. The window size for the average area is set to 10 seconds.
![]()
Notice that we know have data from a 10 second average, and a plot showing extreme detail after the trigger level is reached (2500µA in this case). The average number is calculated over the 10 second frame, and shows 33.24µA, which is fairly close to the Keysight measurement of 33.484µA. Since we now have both plots we don’t need to set up another measurement, but simply stop the data acquisition and zoom in to the areas we want to look closer at, for instance, the sleep current.
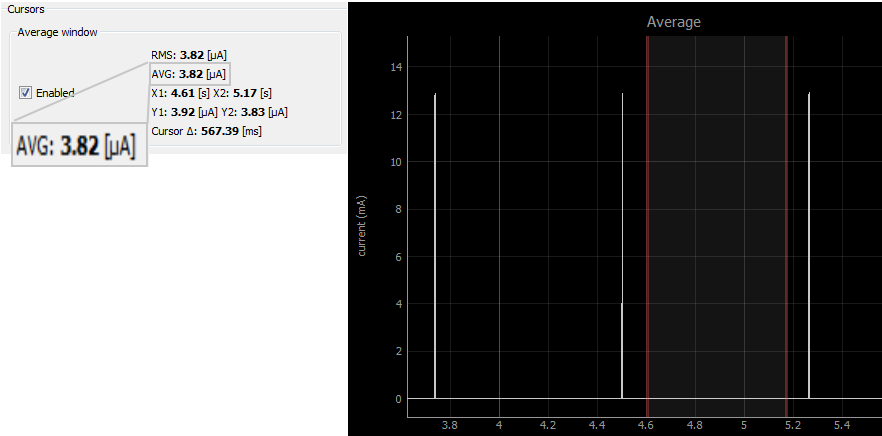
Keysight gave us 3.876µA, where the PPK measures an average of 3.82µA. We can also look at the trigger window, where we clearly see that we only have TX events. The average calculations for the events are close to identical. The PPK measures 5.95mA, Keysight shows 5.92mA.
![]()
How it works
Automatic switching
Often when using small, cheap instruments for measuring current, the user needs to set a specific range to enhance resolution for the desired measurement area. One of the major benefactors of the PPK is that the range is automatically switched by hardware, so you will keep a great resolution all the way from sub microamps to several milliamps. This comes with the caveat that if your measurement is stable around any of the switching points, the switches will work really fast and may distort the measurement. Therefore, the switching points can be adjusted from software if necessary.
Software
The software is written in Python, thus it’s source is freely available for anyone. The choice of using Python came from the fact that the developers of the PPK are primarily firmware and hardware developers, thus Python seemed to be the best choice. Also, since we have an interface to the nrfjprog tools from Nordic, pynrfjprog, this makes it even more convenient to use. The software will be updated on a regular basis, to improve stability, user interface and add more features. By giving you the Python source files, this means that you can fiddle around with it and create what you want. We are planning on also making a Python API that developers can use to create their own automated tests by using this hardware. By using the trigger capabilities of the PPK, such tests can be quite extensive, with automated firmware swapping and current analysis at specific times or consumption levels.
The PPK uses the on board debugger of the DK to transfer measurement data through Real Time Transfer (RTT). This way, we don’t need any USB handling on the PPK’s nRF52 or use UART which is much slower. Still, the RTT capabilities of the on board debugger is not able to handle all data raw, hence, we have divided the plots in to two. The top plot shows data that is averaged by a factor of ten. This way, the PPK is able to push continuous data to the software for this window. The bottom plot is plotting all samples the PPK can produce for a shorter amount of time, and only when the trigger point has been reached. This way, you can trigger at levels that shows interest in the average plot to further inspect these events on a very detailed level.
Hardware
The brain of the PPK is the nRF52. Combining its ADC, PPI and GPIOTE abilities, we are able to sample an averaged sample (to reduce noise etc) every 13µs, while also keeping watch of the hardware switches state to know what measurement range we are currently in. Having access to a CPU with great performance also allows the nRF52 to do calculations and packaging of data fast enough.
The current is measured as the voltage drop across three resistors in parallel. Two of these resistors have a switch in series so they can be connected / disconnected from the circuit. There are analog comparators monitoring the voltage across the resistors. Together with some digital logic and reference voltages, these controls at which current level each of the two resistors shall be connected / disconnected.
Each Power Profiler Kit has its actual resistance measured in production and stored in an EEPROM. The resistance of each measurement resistor is shown in the software. These numbers are unique to every Power Profiler Kit due to component variations etc., so the numbers in the screenshots seen here might not be similar to the values you have in your software when using the kit. If you for any reason adjust these resistors, you can always go back to the ones stored during production.
For more information about the product and where to buy, visit the product page.