Short note how to make FreeRTOS program debugging with eclipse little simpler.
If you are looking the information how to configure the whole environment see this post: https://devzone.nordicsemi.com/tutorials/7/development-with-gcc-and-eclipse/
What we get out of the box
Most low power applications stays most of the timer in idle. Ideally it would be tickless-idle. The problem begins if our program behaves strangely and we would like to stop it and check what is going on.
Lets get blinky_freertos example. Run it and halt just in random moment. Until you are very lucky you would stop somewhere in the FreeRTOS files:
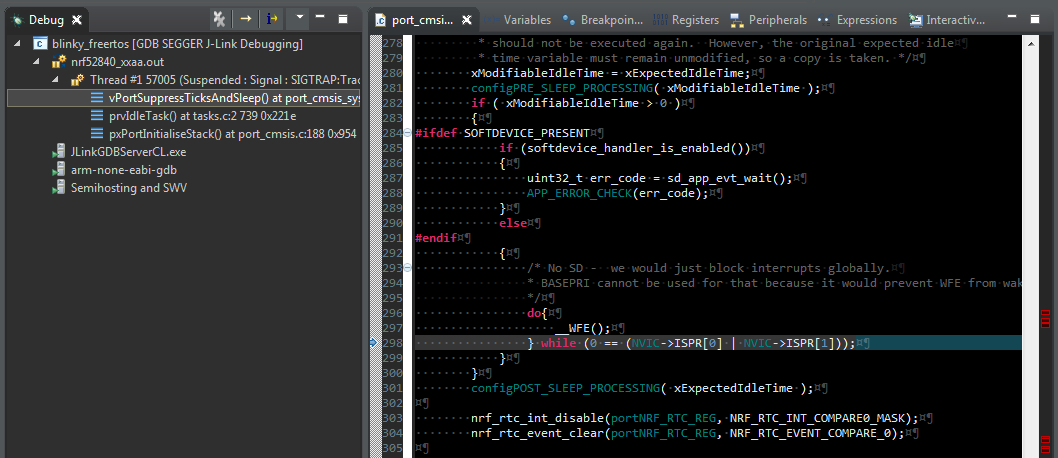
The problem is that in most cases we would land in IDLE task. And there is no easy way to see the state of the task of our interest. Or is there?
Activating j-link rtos plugin
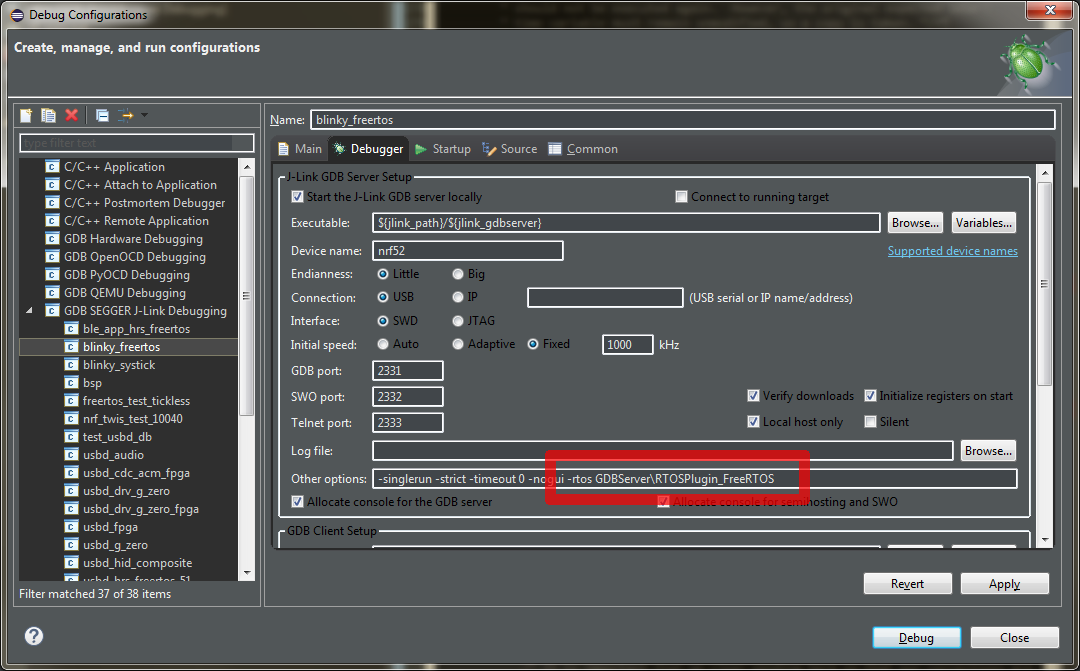
J-link server provides proper support for info thread gdb command by special rtos plugin. To enable it just add an option to command line:
-rtos GDBServer\RTOSPlugin_FreeRTOS
See debug configuration below as a template:
Now when you run the debug and pause it, you would probably stop in idle task anyway. But all the tasks would be listed and you can easily go to the source where it waits just by clicking in the thread backtrace:
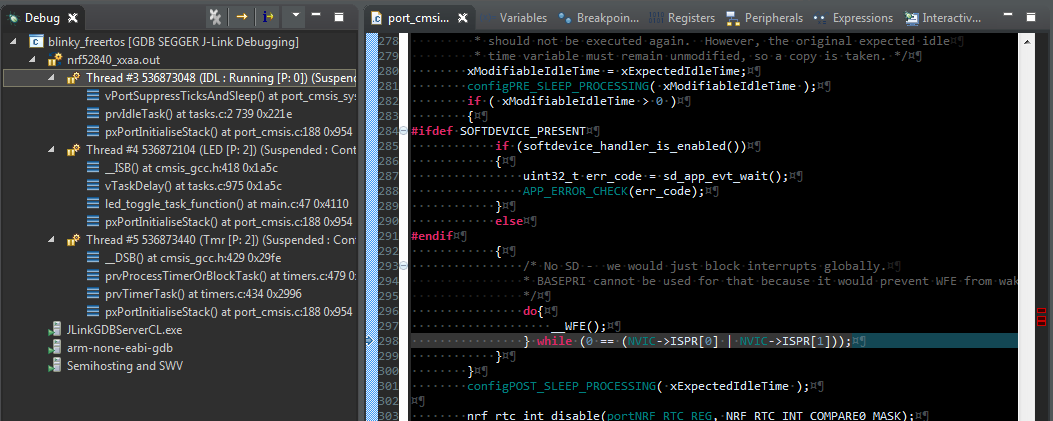
In the image above you may see that simple freertos_blinky example utilizes 3 Threads:
- IDL - Idle
- LED - our LED loop
- Tmr - Thread that processes the timers
Bugs in jlink 6.12a
I have experienced some issues with the -rtos option when program was compiled with -03 optimisation option - the debugger often crashes, inside RTOSPlugin_FreeRTOS.dll library, when trying to stop inside a FreeRTOS task. With -00 there was no such issue.
Problem disappeared after jlink 6.14c was installed. You can download newest jlink software directly from Segger site: https://www.segger.com/downloads/jlink.