The information in this post is outdated. Please refer this tutorial for updated information.
Motivation
Monitor Mode Debugging solves the biggest problem when debugging nRF5 devices. It allows BLE applications to be debugged without crashing after setting breakpoints/pausing execution, and is an order of magnitude better than the default 'halt mode' debugging in these situations. The IDE does not notice any difference between halt and monitor mode debug so this will work with whatever IDE you are using (will work in GDB as well). This post will serve as a step by step guide to set up and use Monitor Mode Debugging with each major IDE Nordic supports (Keil, IAR, SEGGER Embedded Studio) and with different BLE examples from Nordic's SDK.
This tutorial should take 20 minutes to work through and by the end of it you will understand what Monitor Mode Debugging is and why you need to be using it. You will also have evaluated it with some BLE examples from our SDK and will have the knowledge to integrate it into your existing project in a few minutes.
- Keil: BLE Blinky example (experimental_ble_app_blinky).
- IAR: BLE UART example (ble_app_uart).
- SEGGER Embedded Studio: BLE Heart Rate example (ble_app_hrs).
Background
In general there are two standard debug modes available for CPUs: Halt Mode (default) and Monitor Mode. In halt mode the CPU is halted and stops program execution when a breakpoint is hit or the debugger issues a halt request - this means peripheral interrupts can only become pending but not taken as this would require execution of their interrupt handlers. As many of you have noticed this causes problems when debugging BLE applications! Certain interrupts need to be serviced to maintain the BLE connection and when the CPU is halted in halt mode debugging this breaks down.
This is where monitor mode debugging saves the day! In monitor mode debugging the CPU is not halted but takes a specific debug exception and jumps into a defined exception handler that executes in a loop. The main effect is the same as halt mode, except now any interrupts with a higher priority than our DebugMonitor_IRQ will continue to be serviced while our CPU is halted. The CPU can also perform some specific operations on debug entry/exit or even periodically during debug mode with almost no delay. We can now effectively debug BLE applications!
Requirements
Monitor Mode debugging will only work on nRF52 series devices because it requires the Debug Monitor exception that is available on Cortex-M4 CPUs.
- Most recent SEGGER J-Link software pack: https://www.segger.com/jlink-software.html. Important: Any revision prior to 5.10r will not work as it is not compatible with our s132 SoftDevice.
- Monitor code to be compiled and linked as a normal part of your application: 2084.JLink_Monitor_Code.zip.
Very Important: Monitor Mode Debugging relies on the Debug Monitor exception. The SoftDevice your application uses needs to forward this exception to your application! s132_nrf52_2.0.0-7.alpha_softdevice.hex (released mid December 2015) and later do this properly, but prior versions of the s132 SoftDevice did not do this!
Also Very Important: Your application's startup files must define the DebugMon interrupt handler. Old '*_startup_nrf52.s' files are missing the DebugMon interrupt handler. Either download the most recent nRF5x-MDK for your specific IDE here: http://www.nordicsemi.com/eng/Products/Bluetooth-Smart-Bluetooth-low-energy/nRF52832, or add the DebugMon interrupt handler to your application's startup file manually. Attached are the startup files 1512.JLink_Monitor_Startup_Files.zip for each IDE that have the DebugMon interrupt handler added to them and are working with Monitor Mode Debugging. Feel free to use them or check your startup files against them.
NOTE: Nordic's startup files define the Debug Monitor handler as DebugMonitor_Handler, while JLink defines it as DebugMon_Handler. You will need to make these consistent by either changing all occurrences of DebugMonitor_Handler to DebugMon_Handler in your startup file or vice versa in the JLINK_MONITOR_ISR_xxx.s file.
Setting up Monitor Mode Debugging
At this point you have downloaded the latest J-Link Software and the J-Link monitor code, checked that your application uses a 'recent enough' SoftDevice, and checked that your application's startup file declares and forwards the DebugMon_Handler.
The following steps are common to all IDEs:
- Add the JLINK_MONITOR_ISR_xxx.s file to your project. You will select this file based on the IDE you are using (this file is not to be modified).
- Add the JLINK_MONITOR.c file to your project and the path of JLINK_MONITOR.h to your include paths (these files may be modified to define the entry/exit/polling functions declared in them if you want to use these features of Monitor Mode Debugging).
- In main.c at the top of your project's main() function add this line of code:
NVIC_SetPriority(DebugMonitor_IRQn, 7ul);
This sets the Debug Monitor exception to the lowest possible priority for nRF52 devices so that any interrupts with a higher priority will be serviced when our CPU is halted.
All we have to do now is enable Monitor Mode Debugging in our J-Link software! This is the only step that varies with your IDE as each IDE has a different way of telling the J-Link software that we will be debugging in monitor mode. The two J-Link commands we must send are:
SetMonModeDebug = 1
SetMonModeVTableAddr = ADDR // ADDR is where your application's vector table is located in FLASH. This corresponds to the start address for your application, probably either 0x1B000 or 0x1C000 depending on your SoftDevice.
Keil
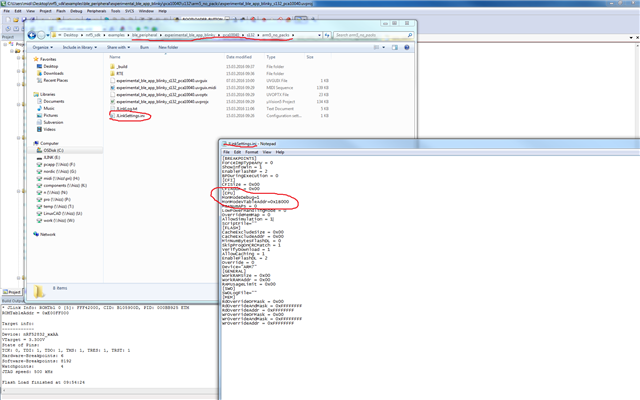
You will need to modify the J-Link settings file 'JLinkSettings.ini' that is created on the start of the first debug session with a specific project. Navigate to your Keil project's directory and edit this file with a text editor adding the following lines to the [CPU] section (see screenshot below).
IAR
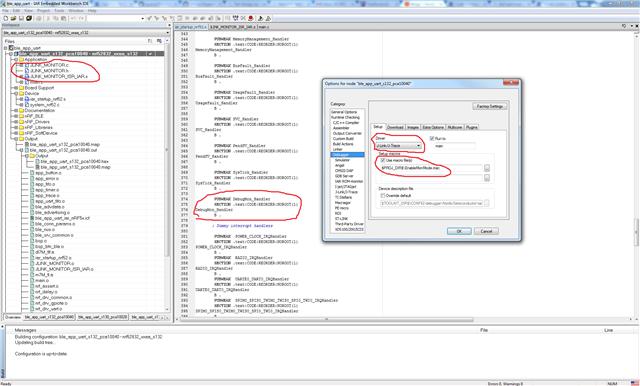
You will need to use the macro file attached, 4382.EnableMonMode.zip. Specify the use of this macro file in 'Options-> Debugger' (see screenshot below).
SEGGER Embedded Studio
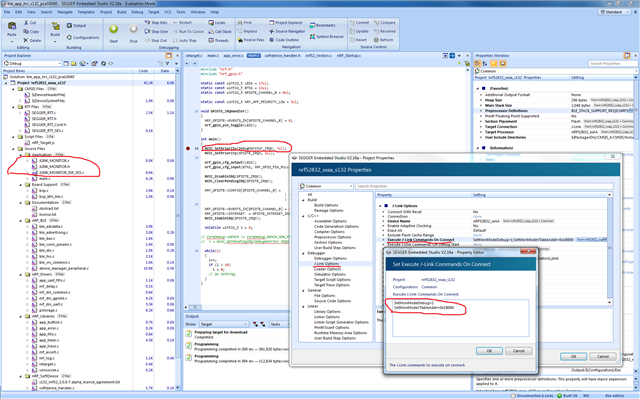
You will need to add the following commands to 'Project Properties -> Debugger -> J-Link Options -> Execute J-Link Commands On Connect' (see screenshot below).
Debugging in Monitor Mode!
That's all it takes to set up Monitor Mode Debugging in any project! Now lets experiment with it. Flash the SoftDevice and Application to your nRF52 device and enter debugging. At some point during this process you should see this popup:
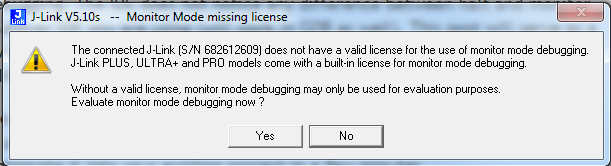
It is very important you see this box and select 'Yes' or else Monitor Mode Debugging will not be enabled. If you don't see this box it means the J-Link commands to enable Monitor Mode Debugging aren't being sent/received properly. Also take note of SEGGER's licencing terms to use this feature.
Important: In the upper left corner of this popup verify that your J-Link software version is v5.10t or greater!
Now run your BLE application. It should start advertising as normal. Connect to it with Master Control Panel or the application of your choice. See that the blinky, heart rate or uart example behaves as expected at this point.
Now either halt the CPU or set a breakpoint to halt the CPU. Notice that you don't lose the connection! For the blinky example you should be able to blink the LED from your app or notice when button 1 is pushed. For the heart rate example you will continue receiving heart rate notifications. And for the uart example you can send and receive strings from the terminal. All while the CPU is halted! Now run the CPU again and everything continues to behave as expected - no crashes or lost state! Mess around with this for a bit and see how powerful this debugging features is.
Future
Please comment with any questions/suggestions/concerns below! For more information on Monitor Mode Debugging please see the J-Link User Guide in 'C:\Program Files (x86)\SEGGER\JLink_V510t\Doc\Manuals.' Chapter 8 is dedicated to Monitor Mode Debugging and is a quick read!