Segger has recently released a number of tools, some of them free, which work with Segger's JLink debuggers, One of those is SystemView, a real-time analysis and visualisation tool. It's cross platform and Segger's page for it is here.
SystemView uses Segger RTT, which is really just a small memory buffer on the target device which the JLink probe constantly reads, to transfer instrumentation data from the target and then display it in a timeline.
SystemView has concepts of task, interrupt and event and the most natural use of it is instrumenting a real time operating system (RTOS), in fact it comes with the source necessary to instrument FreeRTOS as well as embOS, Segger's RTOS. However the instrumentation API is documented and available to add to your own code, so I put some code together to instrument the softdevice calls and events as well as interrupts to see how well it lets you visualise an app running on an nRF52.
If you download SystemView, at least version 2.36a you should be able to look at the saved trace file, RemoteSession.SVDat.
In order to see the calls properly labelled you also need the definition file, which is this one, SYSVIEW_Softdevice.txt.
That file has to be placed in the 'description' subdirectory which is in the same place as the SystemView executable and you need (at least on OSX) to run SystemView directly from that location or it doesn't read the file. On Windows you may just be able to put the txt file in the right place and double click .. I've reported this to Segger and hope it will get fixed. There's more about the right directory for this file in the manual which comes with the software.
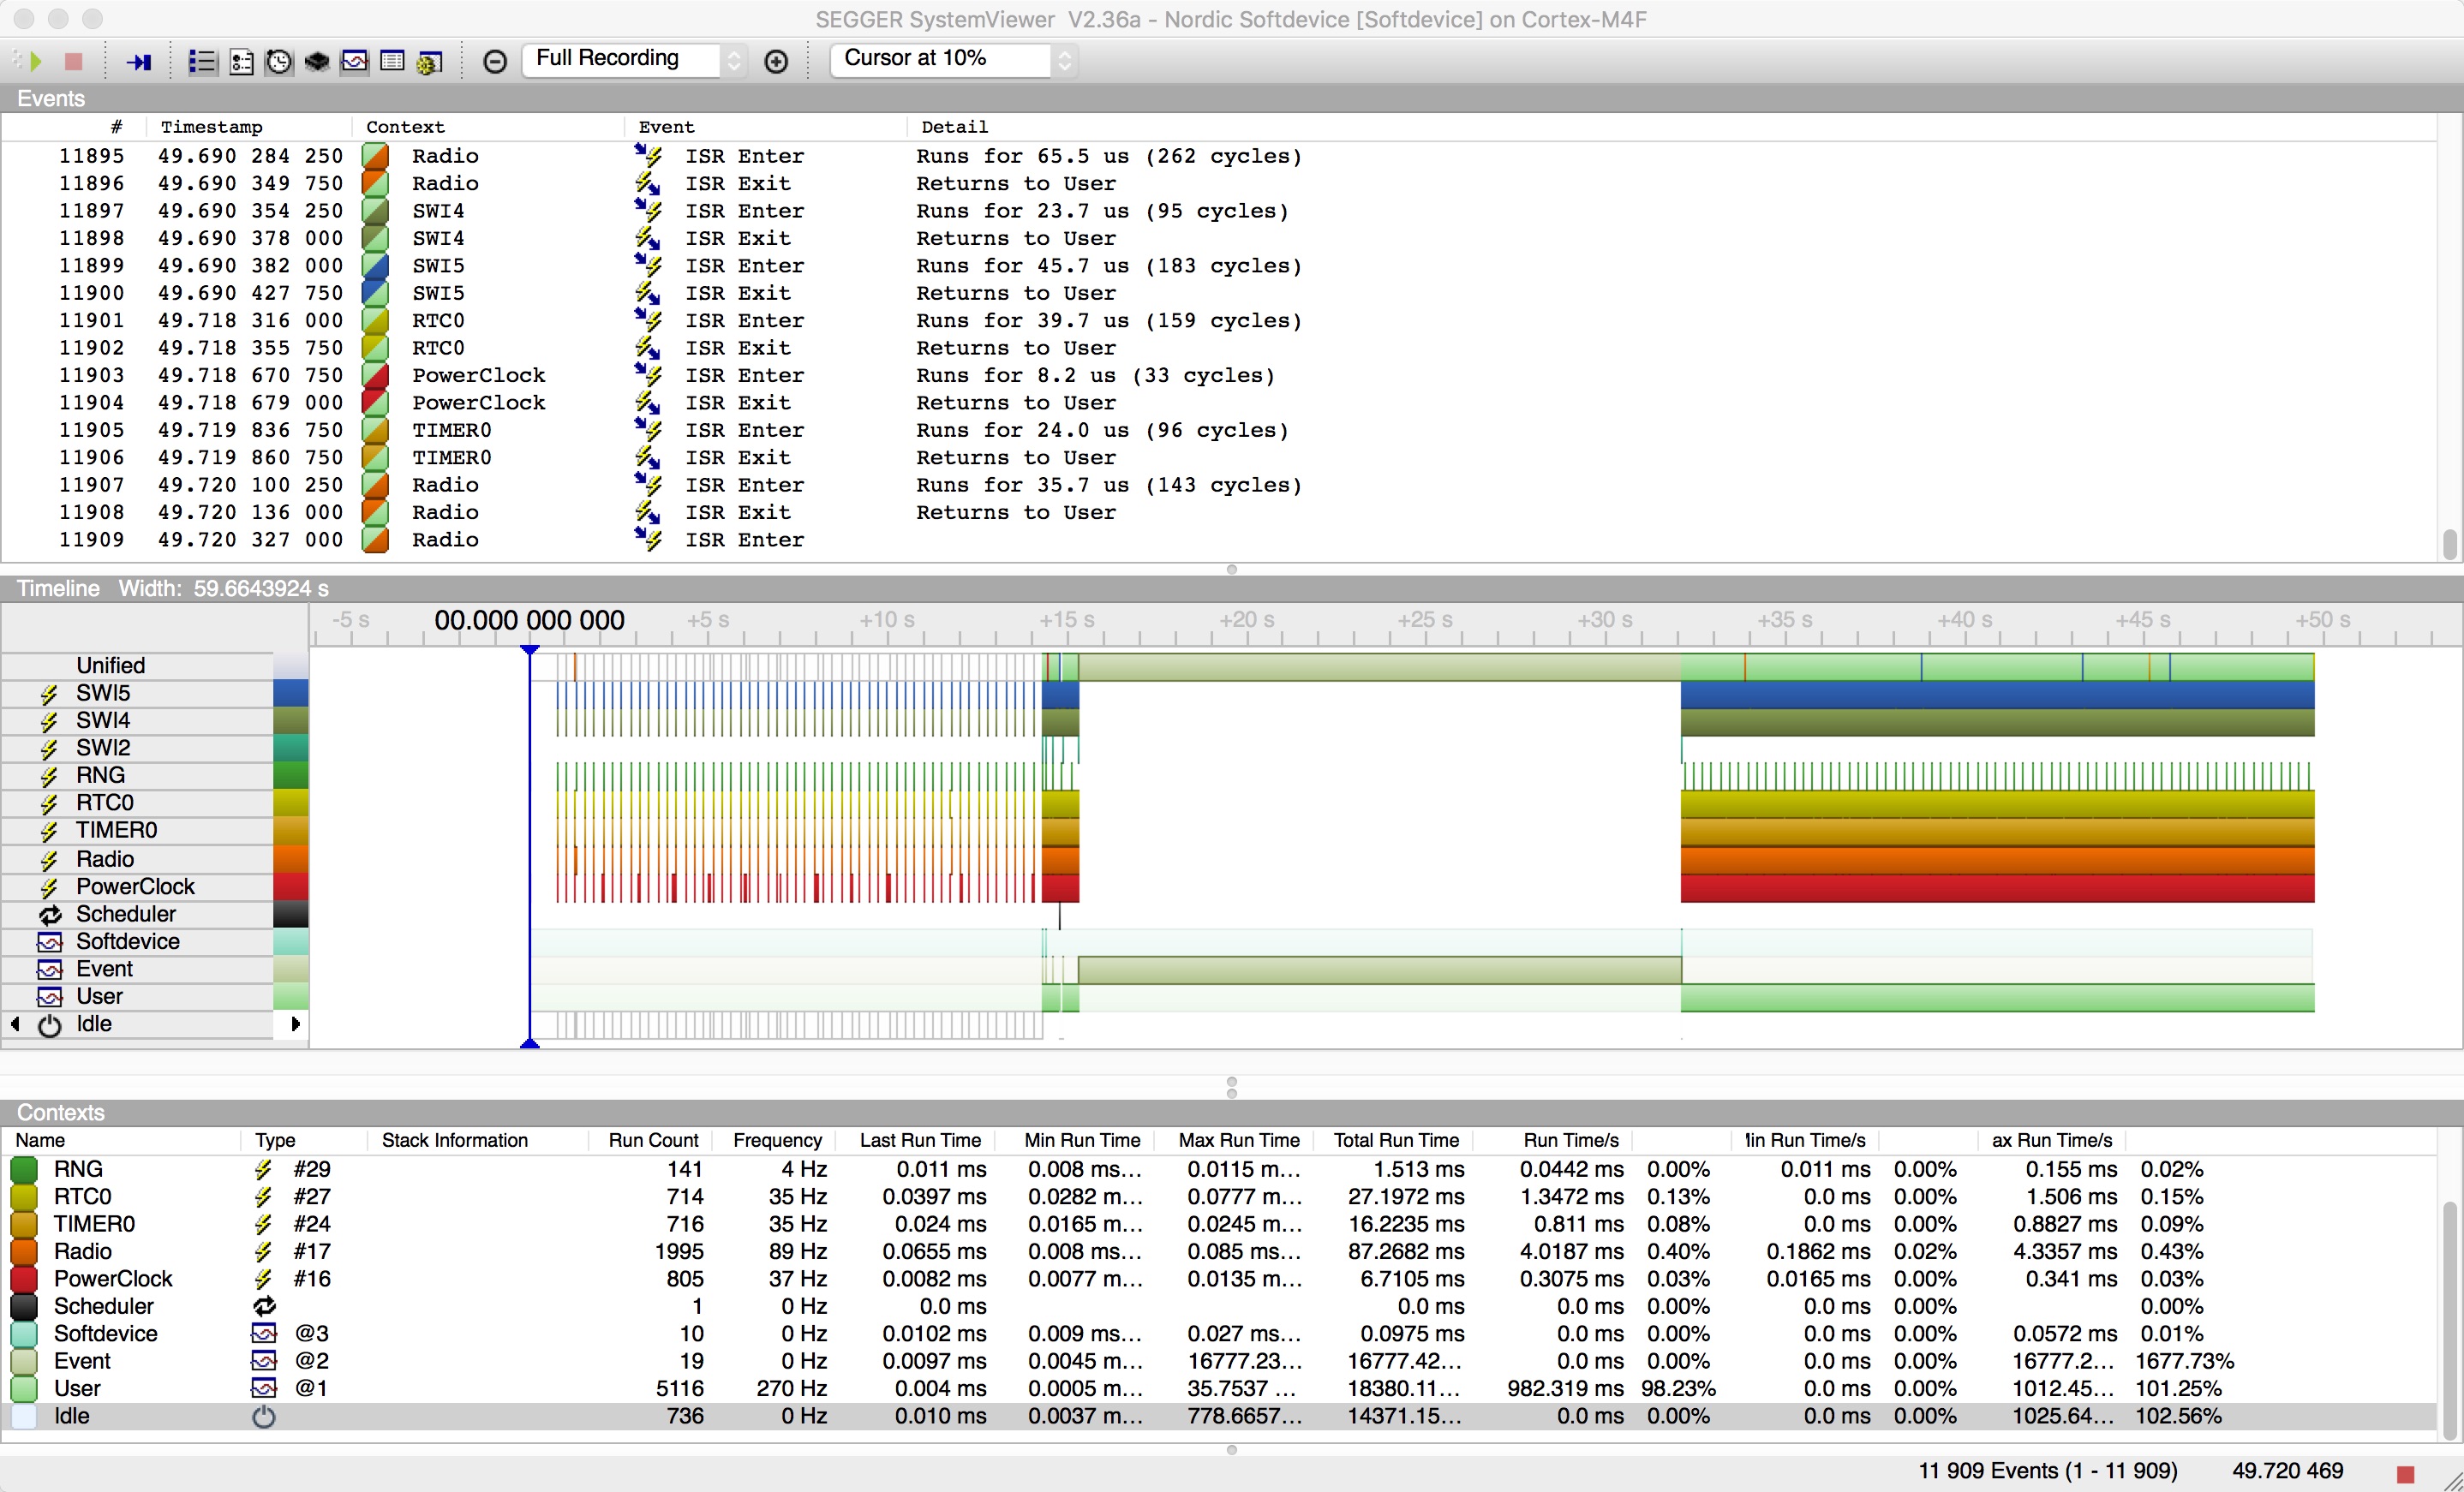
If you have it working, it should look something like this
So what we have here is one session of one of my own apps. It's a bluetooth remote control which allows you to turn a number of relays on and off and also program it with a timed sequence. This app uses advertising to report some of its state, even when it's in connection, so multiple clients can see what's going on, even though only one can be connected at any time, so the advertising data is occasionally updated.
In this log the device advertises for a while, then I connect to it, change some of the switch states, program in a sequence to run and after it's complete, disconnect again. Then another client connects and disconnects. I set it up to log the RADIO interrupt (because it's fun), RTC1, which I use as the timer for the timeline, SWI2 which is the softdevice 'you have events interrupt' and all SVC calls and events.
Because this isn't an RTOS there really are no tasks, however the instrumentation code pretends that there are, a User task, a Softdevice task for all your sd_* calls and an Event task where all incoming events are shown. This has the slightly annoying feature that each time it switches between tasks you get a 'Task Run' message, but I think it's worth the clutter to get the breakdown.
At a high level you can see that the RADIO interrupt, which is in red, ticks along during the advertising periods at the start and end but when in connection fires constantly, as you'd expect.
The top line (just below Unified) is the SWI2 interrupt, each time that fires you are getting an event, and you can see that too in the Event line at the bottom, after every SWI2 interrupt, the app fetches events. Usually after an event is fetched there's something to do, so the lines showing Softdevice, the line above, occur just after the incoming events. Finally you can see the RTC1 interrupt, my timeline ran for 30 seconds, 5 seconds at a time before turning itself off and you can see each of the ticks when it fired.
The top panel shows a list of all the events which happen, including the ones which fake task changes, you can filter those out and just select API calls with View->Event Filter->Show APIs only and if you do that, the top of the log shows something like this
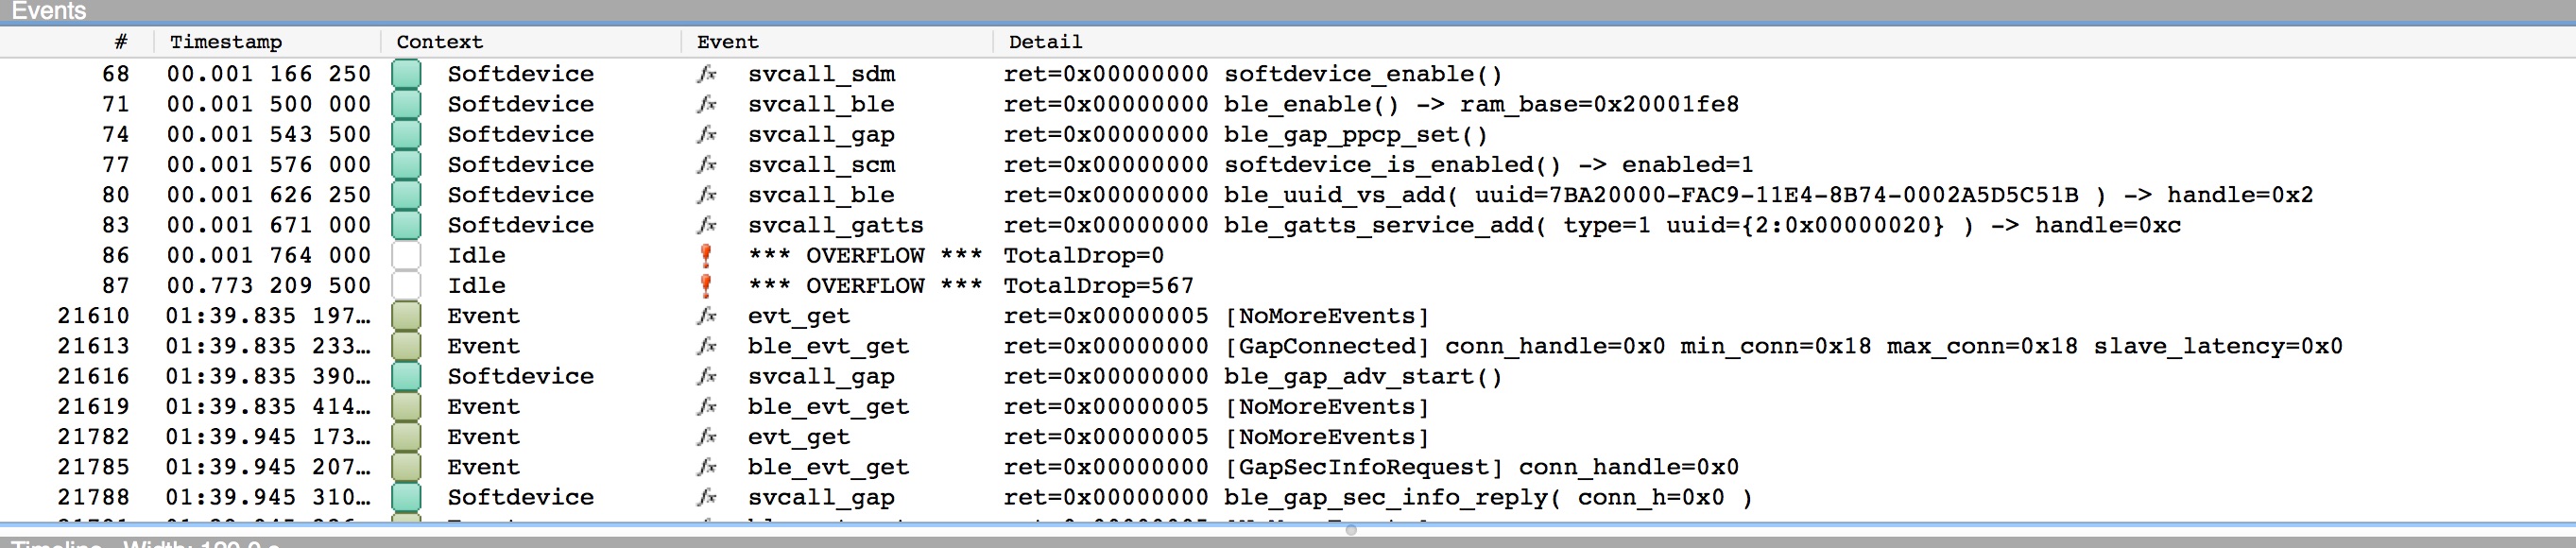
Each line is either a svcall, of a given type, or an evt_get or a ble_evt_get. The return is shown, should usually be 0x00, the name of the svc call plus possibly some of the input arguments and some of the returned values, eg
ble_enable() -> ram_base=0x20001fe8
shows that ble_enable() was called and ram_base it returned was 0x20001fe8, a few lines further down a UUID is added, the uuid sent in is shown and the handle returned, 0x02 is at the end of the line.
Apart from the buffer overflow (I didn't make it quite large enough for the test) you can see a fairly standard startup, enabling the softdevice and bluetooth, adding a service and then you miss the next bit of adding characteristics and starting advertising.
If you keep scrolling down you'll see the client connecting, security being established as this client is bonded, writing values (authorized writes), values being set and notified, advertising data being encoded and set (as the state changes, so the advertising data is updated) and eventually a disconnection.
Turning off the filters again to show all events (View->Event Filter->Reset All Filters) and going to event 96576 (Go->Go To Event...) then zooming in you'll get a picture like this
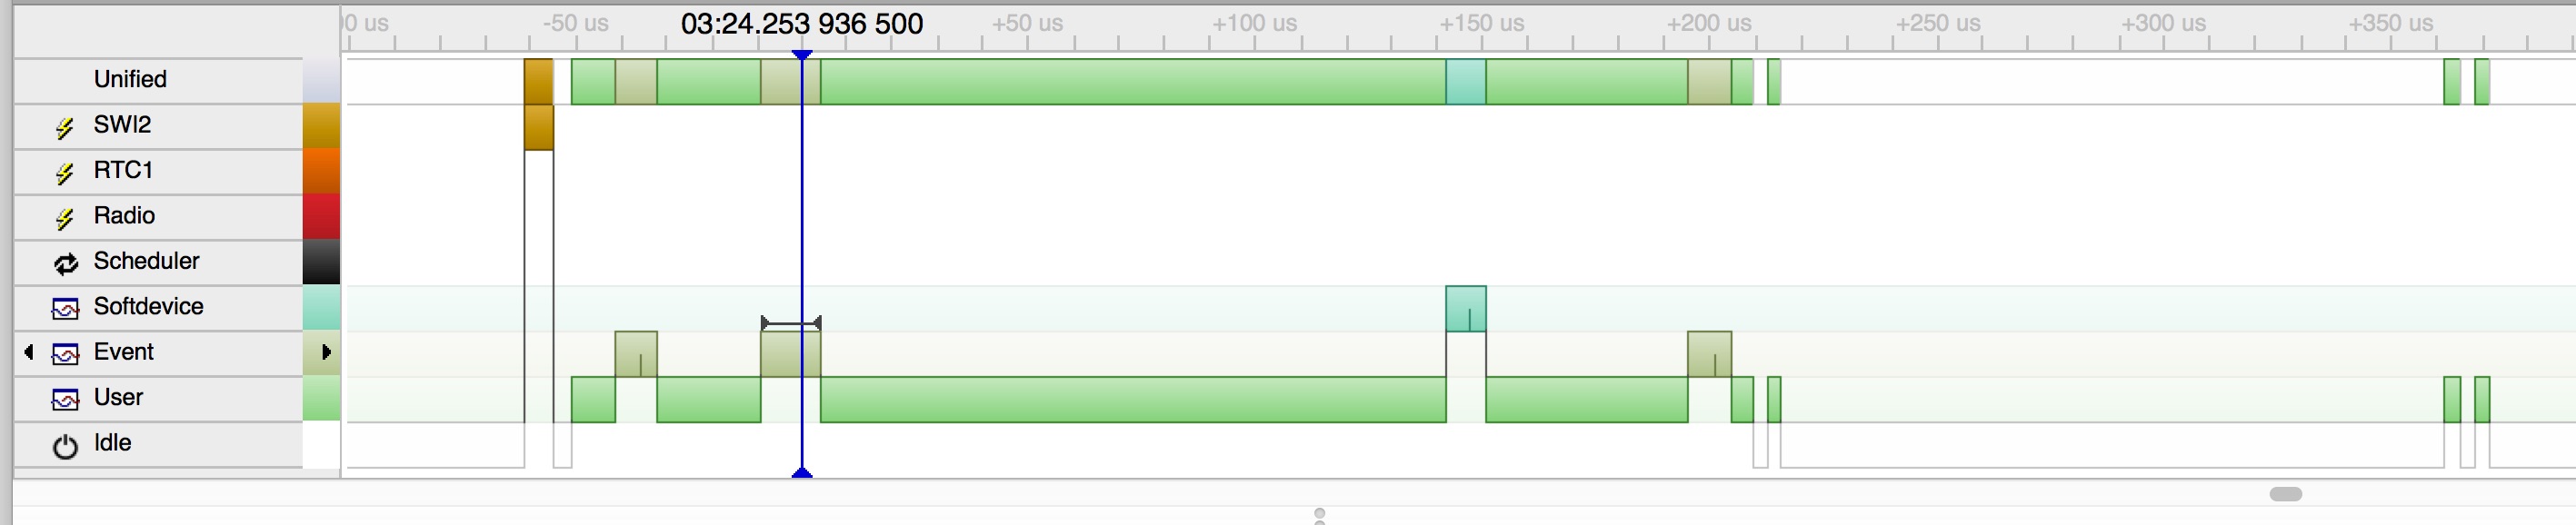
unfortunately my capture program doesn't capture tooltips, if you mouse around that view you'll get a tooltip which shows the previous event in the same format as the log file at the top, which is very handy. You can also see this sequence in the log viewer at the top of the screen.
So what we see here is the sequence starts with an SWI2 interrupt to tell the app there are events waiting. The first one is an evt_get() which returns no events, then a ble_evt_get() which returns the connection event, which is logged with some of the details about connection interval and slave latency. If you look in the event logger or mouse over the softdevice event which follows you'll see it's a svcall_gap, ble_gap_adv_start(), that's the app re-starting advertising in non-connectable mode so that other clients can still read the state. Finally there are no more events and the app goes idle.
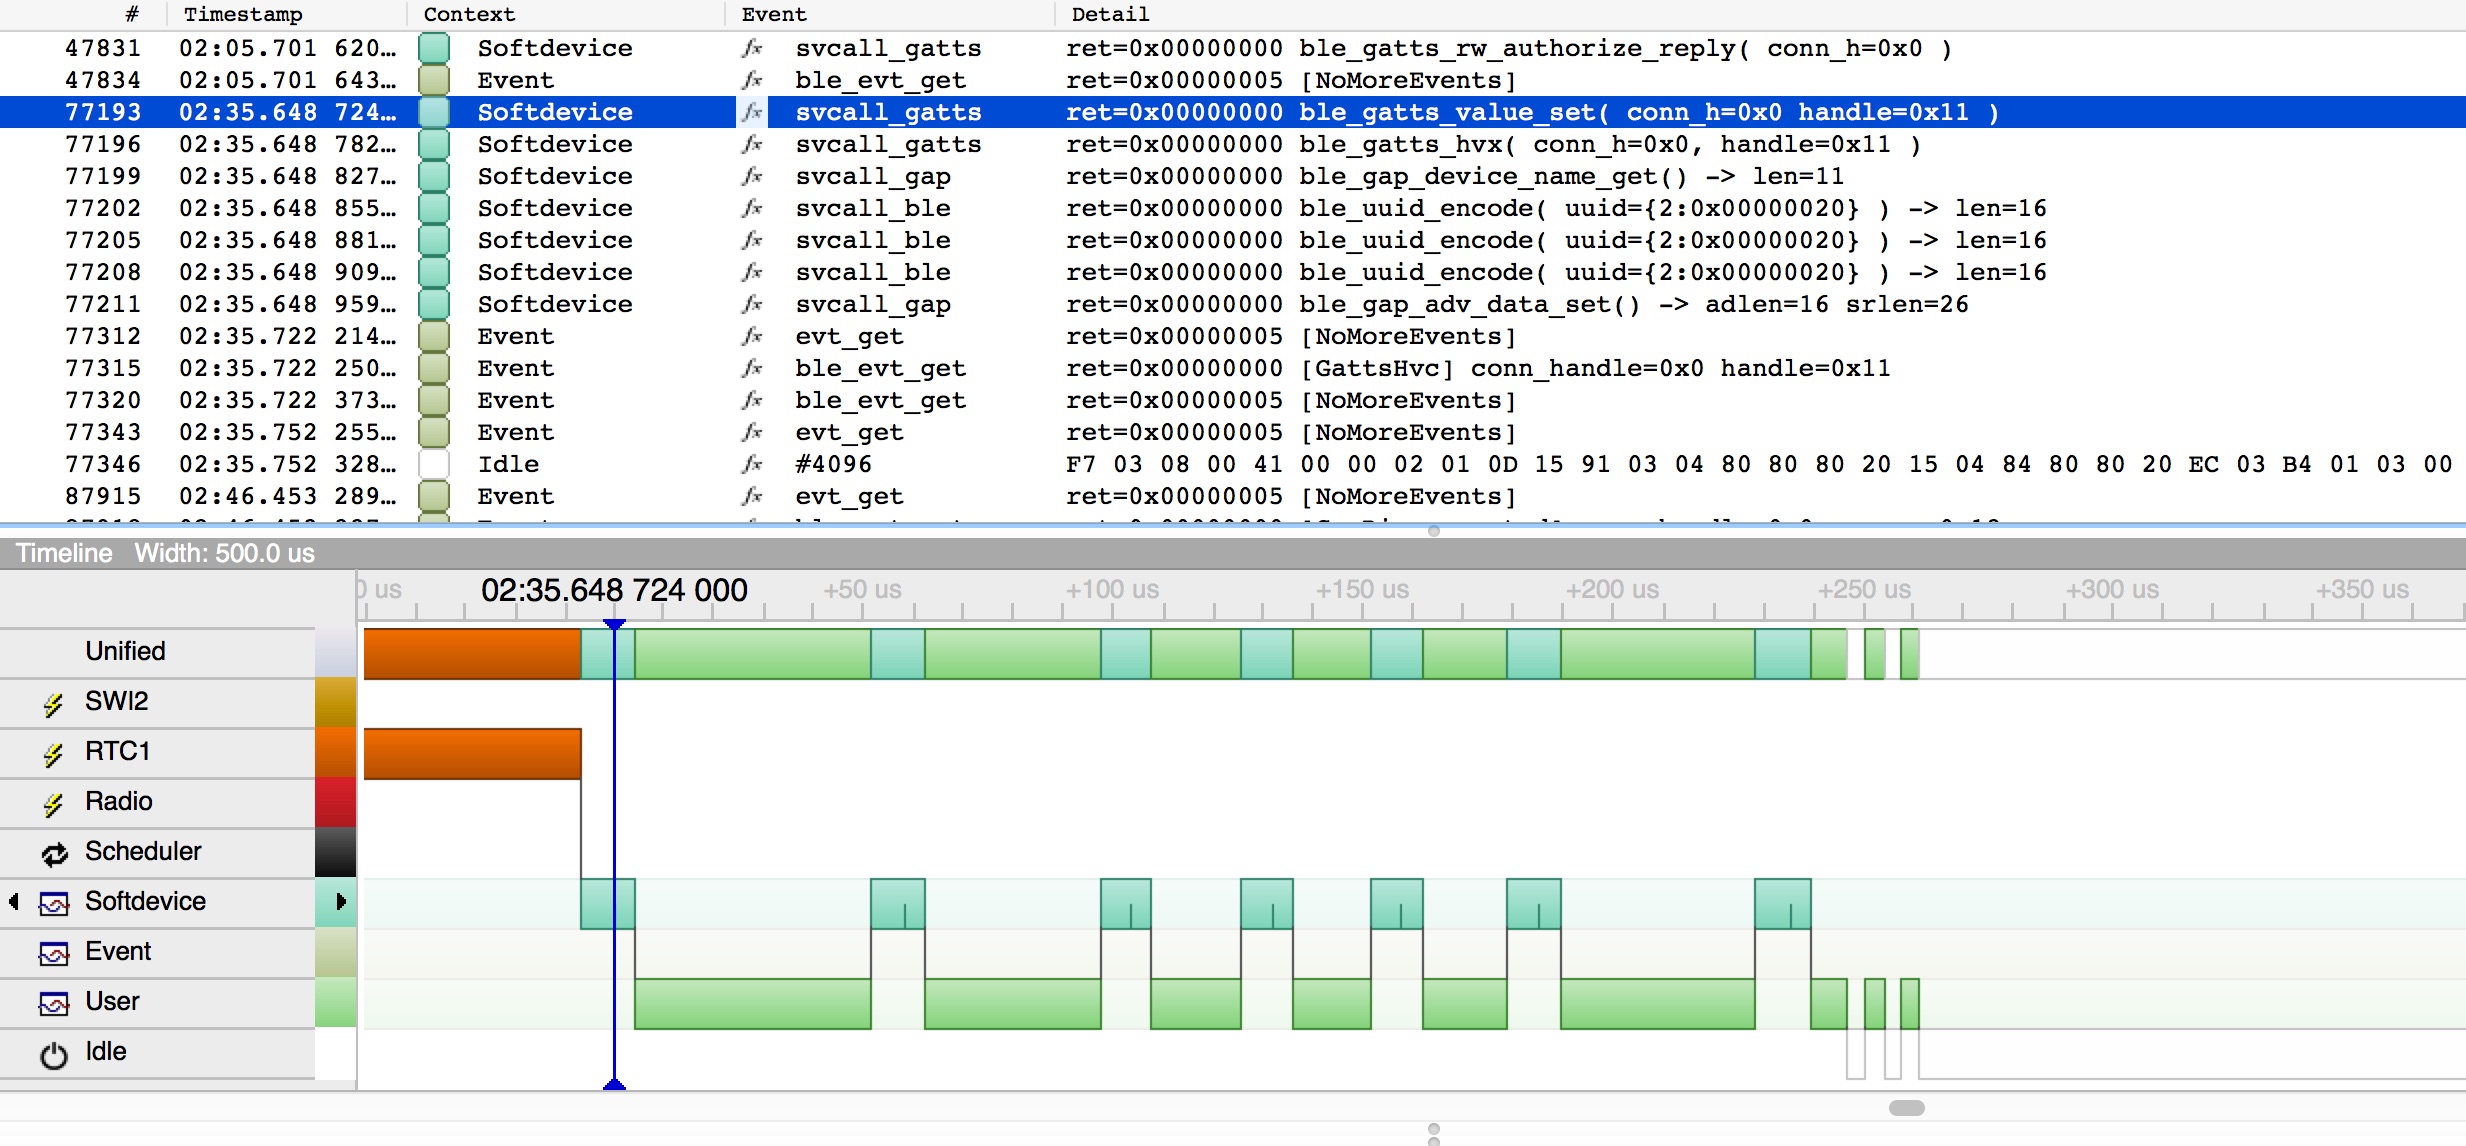
Event 77191 is an RTC1 interrupt, the last one in that timeline, which then updates the switches to 'off', updates the state and sends out a notification. By showing just API calls and the event you can see all the softdevice calls in the order they are made, all starting with the RTC1 interrupt.
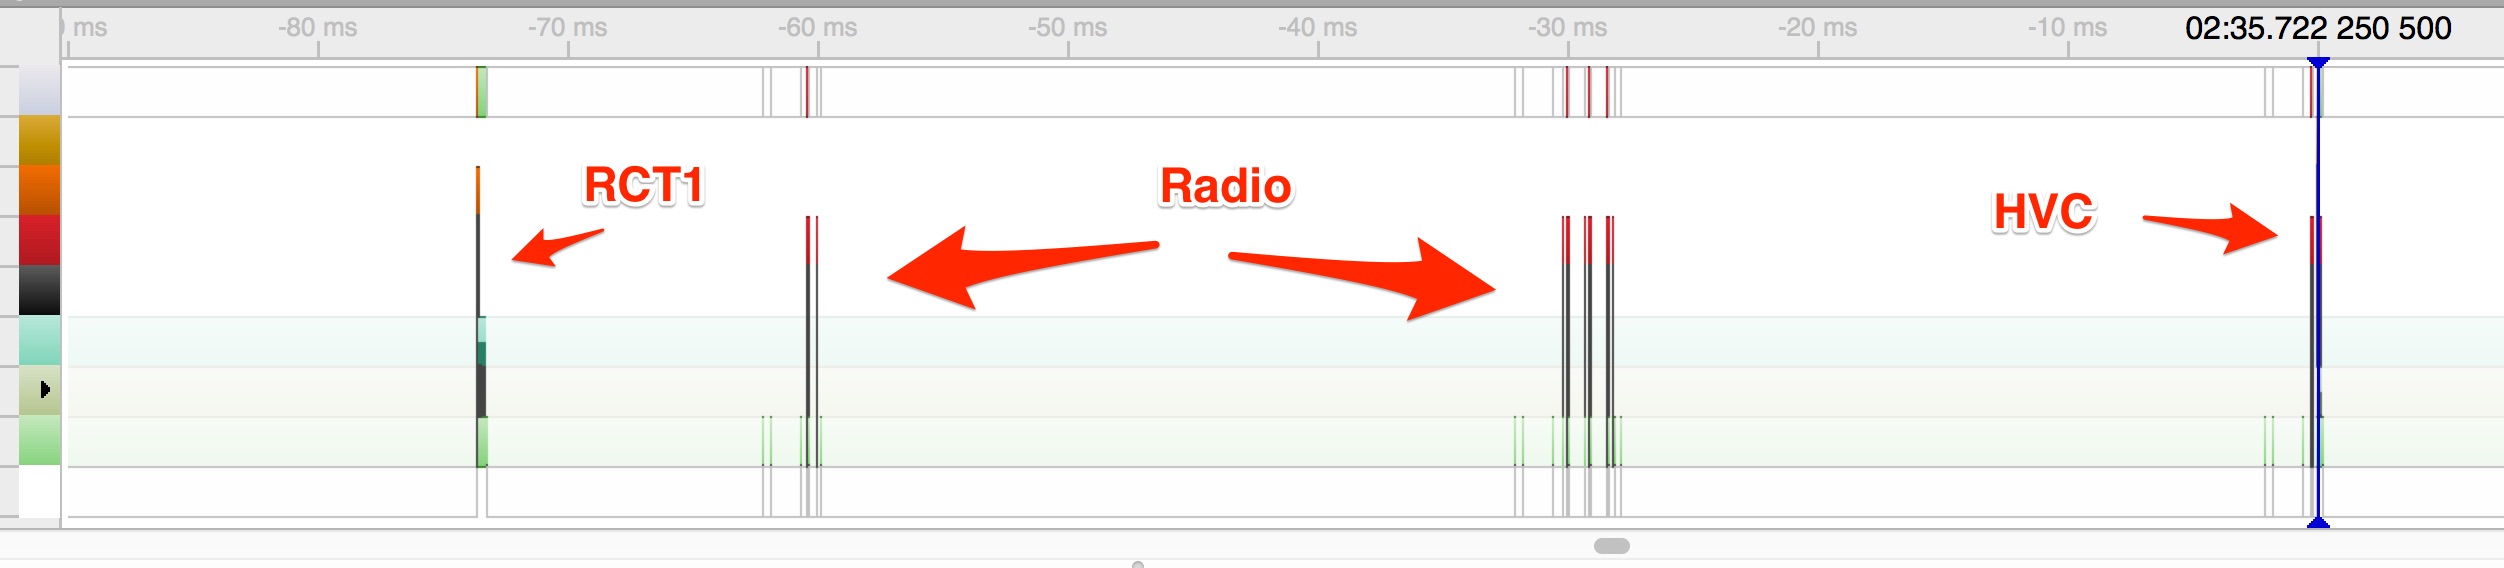
if you zoom out from there looking for the next SWI2 interrupt you can even see there's a couple of bursts of radio activity and then 70ms later the handle value confirm comes in, which the SWI2 interrupt alerts you to.
There's plenty more detail there if you look through the events and this data was all captured, in real time, with the application running and in connection. There is also a post-mortem mode where events are written to a buffer, overwriting as it goes, so if you have an app which fails only occasionally you can leave it running, wait for it to fault and go to a spin error handler or hardfault, and have SystemViewer read the last few things which happened out of the buffer. Since the return value and some of the parameters to the call are logged, you may be able to work out which call failed.
And here's the code I added ..
sysview_all_irq_log( false );

// log the radio, SWI2, our use of RTC1 and SVC calls
sysview_irq_log( SWI2_IRQn, true );
sysview_irq_log( RADIO_IRQn, true );
sysview_irq_log( RTC1_IRQn, true );
sysview_irq_log( SVCall_IRQn, true );

// and enable it
sysview_softdevice_enable( true, true );
By default all logging is on, which is crazy and I should probably change that, so it disables it all, then just adds back the few items I wanted to see, then it turns on the logging and says it wants the User/Softdevice/Event artificial breakdown.
sysview_softdevice is a chunk of assembler which does some fairly evil things and then calls out to some C which calls the SEGGER_SYSVIEW logging API commands. Then there's a huge mapping file which maps the event and service numbers in the softdevice to the internal numbers the logging code uses (and which you can see in the .txt file which contains the description).
Currently this only works for S132 V2.0.0, the release version on nRF52. It would be a little harder to port to nRF51 just because the Cortex-M4F has features which make it easier.
I've attached a header file and a without-guarantees library. It contains the assembler shim, the logging code and the definitions for S132. It also has the SEGGER_SYSVIEW code and SEGGER_RTT embedded in the library because SYSVIEW wants certain RTT features, so if you link it with something already using RTT, either turn that off or remove the RTT code and use the one in the library.
Use the functions in the header file to turn it on and off and configure what you log as per the example above just adding it into main() somewhere, add the library to the link path and see if it works. I've tested it only on Crossworks (which is similar to Segger Embedded Studio) and so it's built with gcc, I have no idea how to link it with Keil or IAR, but it's library so it ought to just work.
Cavets: It may not work at all, your chip will probably not brick or go on fire, if it does, I'm sorry.
The code does some fairly intrusive things and tries to hide what it's doing from the softdevice which occasionally figures it out, gets upset and hardfaults on you. The MWU code was particularly tenacious in that respect (!).
If you go crazy logging stuff you will eventually break the running app, although it manages to keep going an awfully long time (see below).
Do not use this in production code. It's a debugging tool, the things it does probably invalidates all the softdevice certification, so, not in production.
Read the Segger SystemView manual and the Segger forums are great if you have questions.
Or read the Segger api document and put some simple logging in your own code to just log the things you want, it's very easy especially if you do it at the application level, something which SystemView definitely supports.
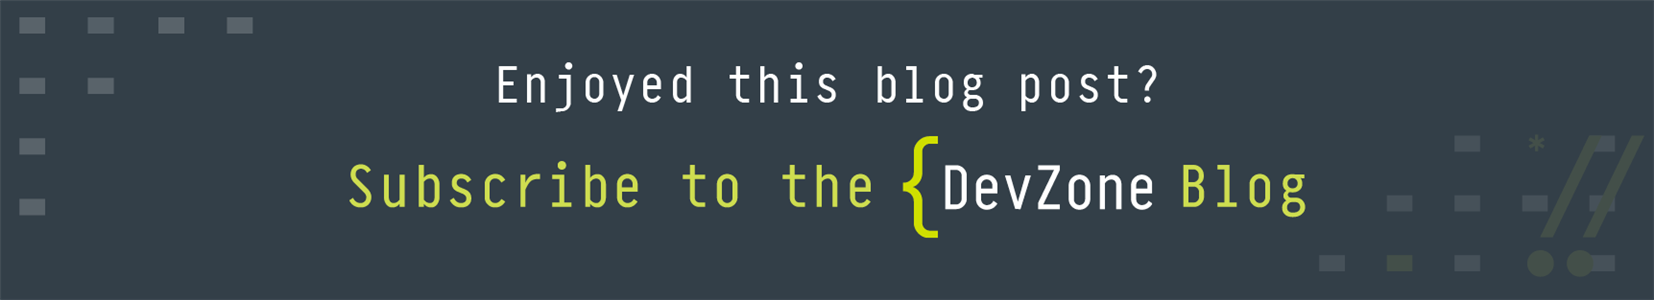
This is what it looks like if you log every interrupt and event and then go into connection on the HRM service. The long gap in the middle is where SystemView got confused as the Cortex-M4F cycle counter rolled over. It logged over 11,000 events in about 45 seconds and the app stayed up through all this and was functional despite streams of events separated by microseconds. Somewhere around the minute mark it finally broke .. but I was impressed it managed to send that amount of data for that long whilst still running a bluetooth stack.