Can one actually debug with an nrf9160DK? Or is it printf debugging with a terminal or RTT? In VS Code, I can get my nrf9160DK to show up as a Connected Device.
Thanks
Can one actually debug with an nrf9160DK? Or is it printf debugging with a terminal or RTT? In VS Code, I can get my nrf9160DK to show up as a Connected Device.
Thanks
DirkH said:I get an Error when I try to send the nrfjprog -i
My apologies, I meant a command line terminal, like cmd or powershell in Windows. If nrfjprog is an unrecognized command, it might be that you haven't installed the nRF Command Line Tools.
DirkH said:I have an older DK from a few years ago:
Do you have other DKs that do connect to VSC? Have any DKs showed up in VSC on this computer earlier?
Regards,
Elfving
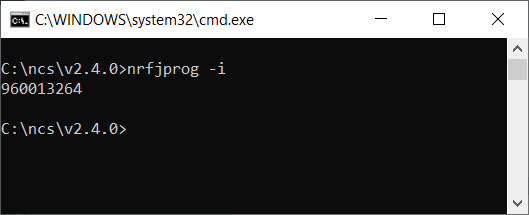
I tried the nrfjprog -i from a command line and it returned 960013264 which is on the label on the back of the board.

Clearly, some processes are communicating with the board.
I have 64 bit windows, and I installed all 64 bit versions of the tools. Should I try installing 32 bit tools.
I don't have any other DKs to try.
I re-installed all the software. Now I can detect the DK in VS Code and debug. I think I needed to select 32 & 64 bit versions when installing nRF Connect for Desktop.
I see. As you can see in the "32 and 64 bit" section and the 64 bit section, those have different versions. We just dropped 32 bit support.
My guess is that you had a different JLink driver pre-installed that is causing this issue, which worked when matched with the 32 bit nRF Connect for Desktop. If you want this completely fixed, and get the newest version of nRF Connect for Desktop, you could try removing all JLink drivers and reinstall 64 bit nRF Connect for Desktop, and install the provided JLink driver.
Regards,
Elfving