Thingy 91 debugging using breakpoints not working

Hello. For some reason I have a lot of troubles debugging my code using breakpoints on Thingy 91 board.

My setup:

Thingy 91 board

VSCode with NCS v2.5.0

J-Link Compact Plus debugger
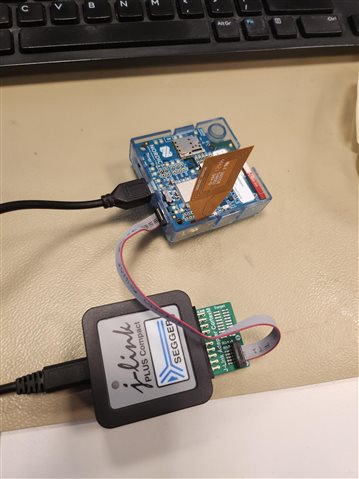
The code that I am trying to debug:

/*
 * Copyright (c) 2012-2014 Wind River Systems, Inc.
 *
 * SPDX-License-Identifier: Apache-2.0
 */

#include <stdio.h>
#include <zephyr/kernel.h>

int main(void)
{
	while(1){
		printf("Hello World! %s\n", CONFIG_BOARD);
		k_msleep(1000);
	}
	return 0;
}

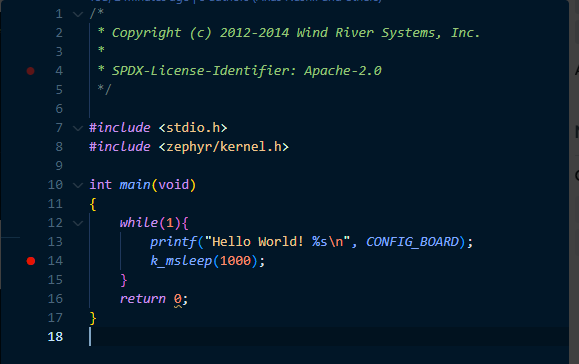
All I did was place a breakpoint:
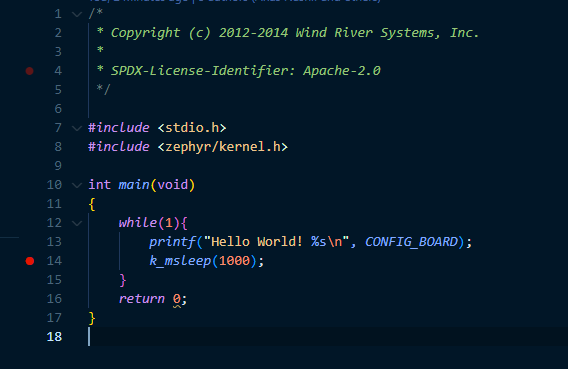
and launch a debug session:
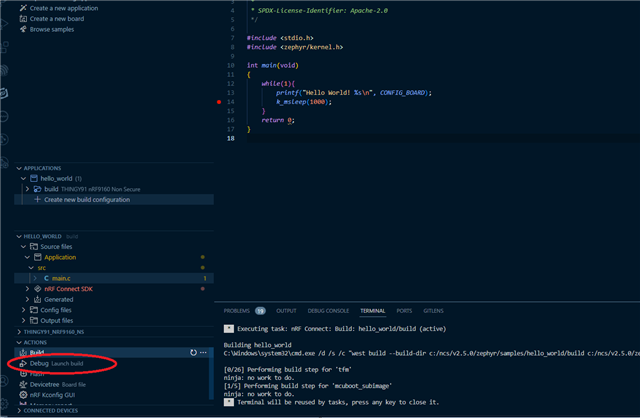
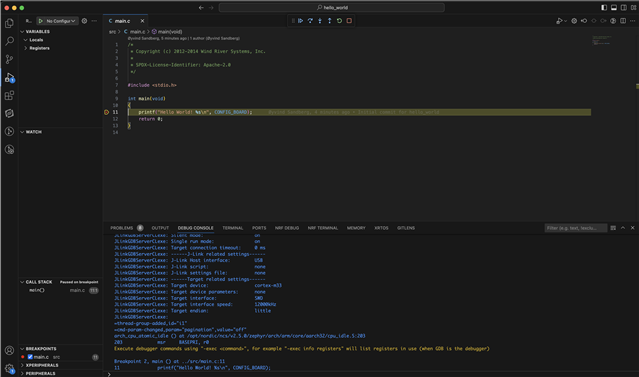
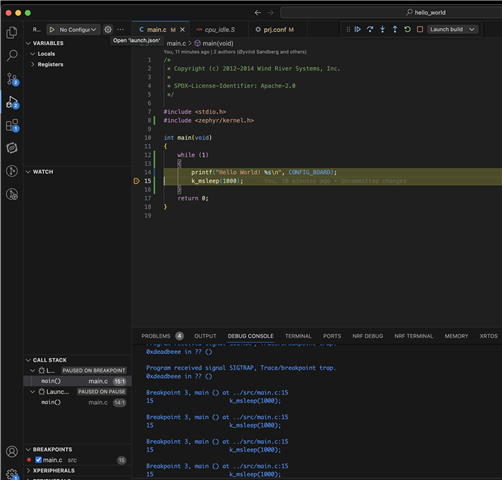
Once the debug session started, the following screen is opened:
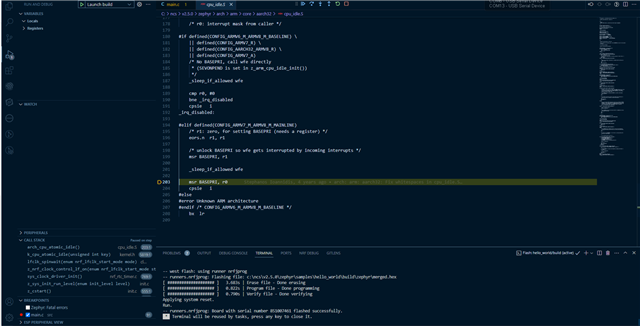
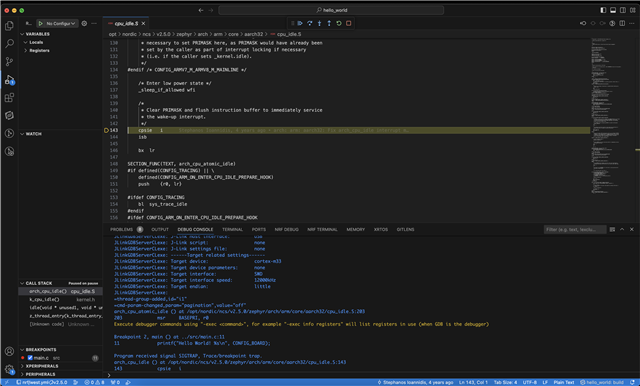
after I click F5 to continue:
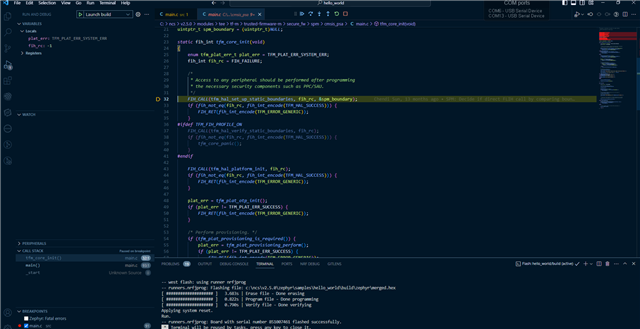
After I click F5 again, nothing happens. The code does not stop at the breakpoint that I have placed. I cannot wrap my head around what could be an issue. Why does it seem so complicated? I would appreciate if someone could point me in the right direction to understand how to properly stop the code at a breakpoint and what is the cause why it does not do it now?

Am I doing something wrong or its just not working as intended?

  • Hello, 

    I've tried to reproduce your issue, running Hello World (NCS v2.5.0) in debug mode. The initial test would stop at break point set in main. 

    Pressing F5 to continue, it would end up here when pressing pause. 

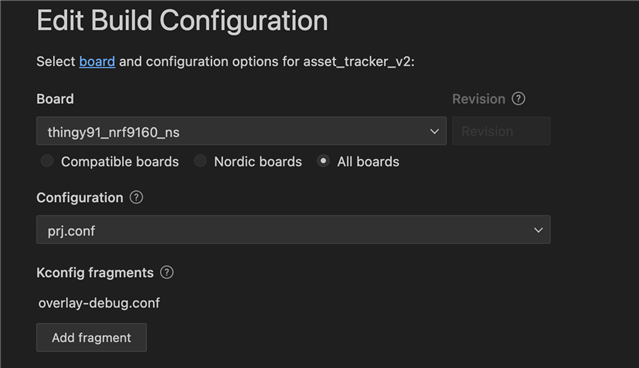
    I did another test with the Asset Tracker v2 instead from v2.5.0, building with debug KConfig overlay

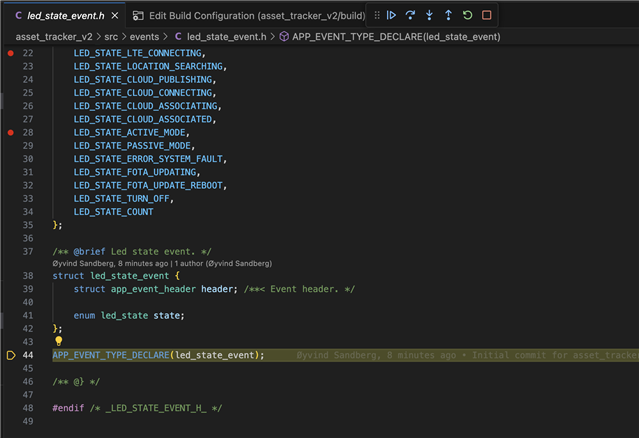
    This would consistently trigger the break point I set in e.g. src/events/led_state_event.h

    Kind regards,
    Øyvind

  • Its great that yours are working great.

    Perhaps you got any ideas why would mine work differently? Is there something else I should try to provide you more information so you can help me out atleast a little?

    You mentioned something about debug kconfig overlay. Thats not something I am familliar with. I dont think I used it. Could that be the case?

    Do you need to set anything in prj.conf?

    Would it help if I share to you the whole project including configuration and everything so you can try to replicate the issue on the exact same project?

  • I just tested without the debug overlay and got the same result. Could you please provide the output of running the nRF Connect: Generate Support information from the VS Code command palette? 

  • Hello! Before I captured the support information I went ahead and tried something else. Please see the image that I have attached on my initial post:

    As you can see, the breakpoint is placed on the k_msleep function instead of printf.

    When the breakpoint is placed on the k_msleep, I will get the behaviour that I have explained initially. However, if I remove the breakpoint at k_msleep and add a break point at printf line (line 13). The debug will work as expected and the program will stop at the printf.

    Is there any particular reason why I would not be able to use breakpoint at k_msleep? Are you able to reproduce the issue if you place it on the k_msleep as well?

  • I'm still not able to reproduce. What does the output in your Debug Console state?

    Here is mine

Related