Hi, I have problems with debugging for the NRF9160-DK. I installed the latest VSCode tools (as described here https://developer.nordicsemi.com/nRF_Connect_SDK/doc/2.6.99-cs2/nrf/installation/install_ncs.html#install-ncs ), compiled and flashed blinky example built with debug optimisation (as described here https://academy.nordicsemi.com/courses/nrf-connect-sdk-intermediate/lessons/lesson-2-debugging/topic/debugging-in-vs-code/ ). My versions are:
NRF toolchain: v2.6.1
SDK: v2.6.99-cs2.
nrf9160-DK: PCA10090 v1.1.3.
When clicking "debug" in the VSCode everything looks good, fw is flashed to the board and we see a highlighted code line at main. Here is the log from debug console:
JLinkGDBServerCL: SEGGER J-Link GDB Server V7.94e Command Line Version
JLinkGDBServerCL:
JLinkGDBServerCL: JLinkARM.dll V7.94e (DLL compiled Jan 15 2024 15:18:46)
JLinkGDBServerCL:
JLinkGDBServerCL: -----GDB Server start settings-----
JLinkGDBServerCL: GDBInit file: none
JLinkGDBServerCL: GDB Server Listening port: 53308
JLinkGDBServerCL: SWO raw output listening port: 2332
JLinkGDBServerCL: Terminal I/O port: 2333
JLinkGDBServerCL: Accept remote connection: localhost only
JLinkGDBServerCL: Generate logfile: off
JLinkGDBServerCL: Verify download: off
JLinkGDBServerCL: Init regs on start: off
JLinkGDBServerCL: Silent mode: on
JLinkGDBServerCL: Single run mode: on
JLinkGDBServerCL: Target connection timeout: 0 ms
JLinkGDBServerCL: ------J-Link related settings------
JLinkGDBServerCL: J-Link Host interface: USB
JLinkGDBServerCL: J-Link script: none
JLinkGDBServerCL: J-Link settings file: none
JLinkGDBServerCL: ------Target related settings------
JLinkGDBServerCL: Target device: nRF9160_xxAA
JLinkGDBServerCL: Target device parameters: none
JLinkGDBServerCL: Target interface: SWD
JLinkGDBServerCL: Target interface speed: 12000kHz
JLinkGDBServerCL: Target endian: little
JLinkGDBServerCL:
=thread-group-added,id="i1"
=cmd-param-changed,param="pagination",value="off"
0x00009f92 in CC_PalWaitInterruptRND ()
[New Remote target]
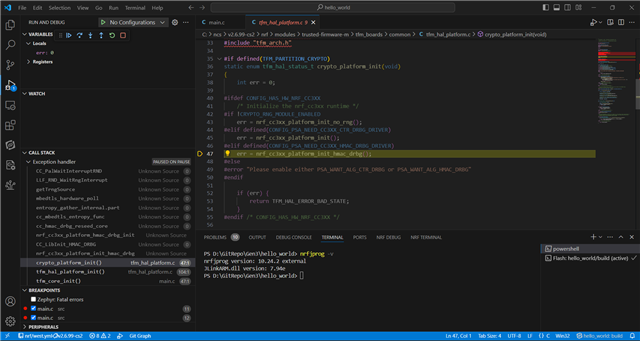
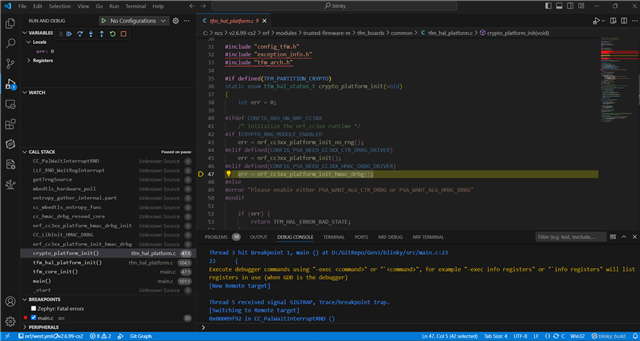
if I then add a new breakpoint in the main and click "Continue (F5)" firmware never reaches that breakpoint, LED doesn't blink, if I press "Pause" I see that execution stops in the file
C:\ncs\v2.6.99-cs2\nrf\modules\trusted-firmware-m\tfm_boards\common\tfm_hal_platform.c at line 47 "err = nrf_cc3xx_platform_init_hmac_drbg();"
complete reinstalling VSCODE and nrf tools didn't help. It looks like there is an issue with TF-M that prevents proper debugging. If I stop the debug session and press reset - LED starts blinking, so the firmware execution is ok. I also tried SDK v2.6.0, it has the same issue. I think that an appropriate debugging is essential for any complicated projects and hope for a help with this issue.
Best regards, Valeri