Trying to figure out a bus fault error (Zephyr + NRF52840)

Hey all,

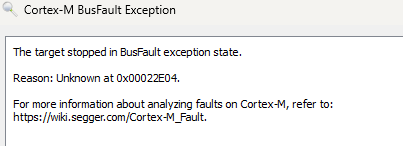
I'm looking for a bit of guidance here to nail a bus fault that happens about 30 minutes into the program. 

The message is the following:

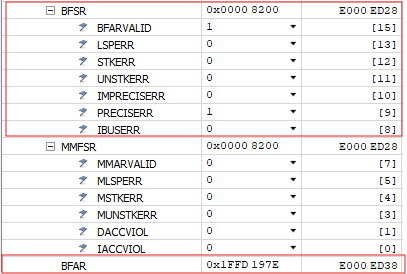
[00:32:57.663,177] <err> os: ***** BUS FAULT *****
[00:32:57.663,177] <err> os:   Precise data bus error
[00:32:57.663,208] <err> os:   BFAR Address: 0x80bf68c8
[00:32:57.663,208] <err> os: r0/a1:  0x80bf68b4  r1/a2:  0x20029668  r2/a3:  0x20029640
[00:32:57.663,238] <err> os: r3/a4:  0x00000040 r12/ip:  0x2002158b r14/lr:  0x0004307d
[00:32:57.663,238] <err> os:  xpsr:  0x91000000
[00:32:57.663,238] <err> os: Faulting instruction address (r15/pc): 0x00043d9e
[00:32:57.663,299] <err> os: >>> ZEPHYR FATAL ERROR 25: Unknown error on CPU 0
[00:32:57.663,330] <err> os: Current thread: 0x20002828 (unknown)
[00:32:57.724,395] <err> fatal_error: Resetting system

Reading through previous threads I found some information:

(base) PS \build\zephyr> arm-none-eabi-addr2line.exe -e .\zephyr.elf 0x4307d
C:/ncs/v2.5.0/zephyr/kernel/sched.c:1959
(base) PS \build\zephyr> arm-none-eabi-addr2line.exe -e .\zephyr.elf 0x43d9e
C:/ncs/v2.5.0/zephyr/kernel/pipes.c:217

That tells me that the error seems to be in one of the pipes. Additionally I found the following:
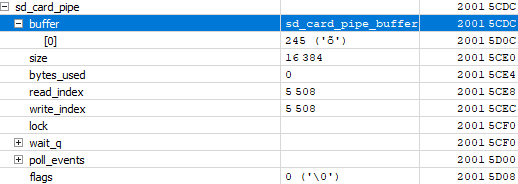
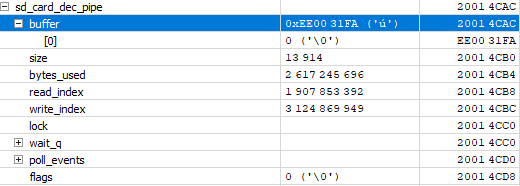
0x20029668:
0x20029640:
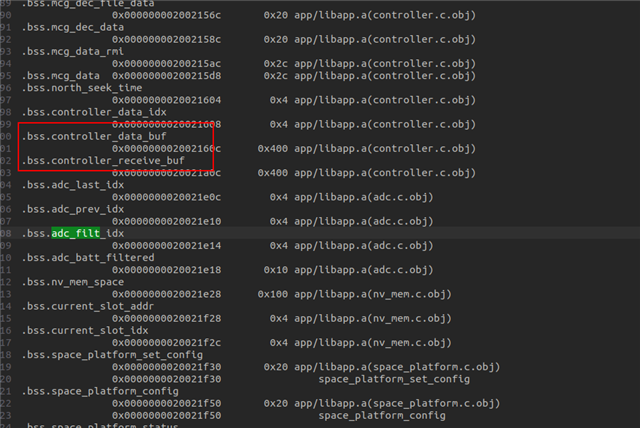
 .noinit."../src/tasks/controller.c".0
                0x0000000020028f60      0x800 app/libapp.a(controller.c.obj)
                0x0000000020028f60                _k_thread_stack_controller_rx_task_tid

It seems the receiver task (controller_rx_task_tid) is causing the issue, which makes sense because that thread is related to writing to some pipes. So far I think I'm able to narrow it to where the issue is happening. 

What I'm confused about and could not find any information about was:

[00:32:57.663,208] <err> os:   BFAR Address: 0x80bf68c8

Is there a peripheral with that address on the NRF52840 series? I could not find that on the product specification. There are two addresses in that range that I'm not sure where they are:

[00:32:57.663,208] <err> os:   BFAR Address: 0x80bf68c8
[00:32:57.663,208] <err> os: r0/a1:  0x80bf68b4

Any suggestions or additional information you can give me that could help me search for other things is appreciated.

Cheers,

Alberto

  • I ran a test increasing the stack for that thread to double the size. In the end that didn't help. It may have lasted a few minutes longer, but I'm not sure, in the end it felt it failed in the same position.

    I will try with the debugger connected tomorrow and disable the reset on hard fault. I will also look at the variables in the map file. Unfortunately the problem seems to happen on a Zephyr file, and I don't have so much experience with Zephyr OS other than as user.

    Thanks for confirming the 0x80bf68b4 is rubbish, and I have a few places I can look at.

    I'll keep you posted.

    Cheers,

    Alberto

  • I was able to attach the debugger and it stopped at the fault. I'm also able to look at the variables and the call stack, and the fault is close to where I expected it to be.

    I also noticed that one of the k_pipes I'm using for data buffering seems to be corrupt. This is a normal pipe with OK values (not sure what "buffer" refers to):

    The one causing the issue looks like:

    I'm sure I must be corrupting it somewhere.

    I'll see what else I can find. Thanks for your input so far.

    Cheers,

    Alberto

  • Hi Alberto,

    Thanks for the update. It does look like there is a buffer overrun that is overwriting more than just the thread object. Maybe you can post the zephyr.map file here. It might provide some clues even though we haven't seen the source code.

    Cheers,

    Vidar

  • Hey Vidar, 

    Thanks, sure, I can upload the map file.

     5141.zephyr.map

    I had some progress. I noticed one pipe where the error was happening had a different buffer size than defined originally, it was larger, so that was overwriting the other pipe I believe. That issue has been solved.

    The test ran now for over 3 hours, unfortunately, there was another bus crash somewhere else which I need to look at now... baby steps.

    I'll try to find out where the error happened now.

    Cheers,

    Alberto

    Edit:

    Looks like another overflow somewhere else...

    That value does not look right...

  • Hi Alberto,

    Maybe the overflow could be in the 'controller_receive_buf' or the 'controller_data_buf' buffer. They are pretty close to the 'adc_filt_idx' in RAM.

    Cheers,

    Vidar

Related