debug nrf52840 zephyr app with threads using JLINK + gdb

hi.

I have a zephyr app that includes threads, 3 to be exact.

I'm compiling thread info using -D param passed on to the west command (well vs code does it for me, i'm just verifying it's there).

When i want to de bug the app i connect j-link to the target and do the following:

1. run JLinkGDBServer -if swd -device NRF52840_XXAA -speed 1000  -rtos /opt/SEGGER/JLink_V798g/GDBServer/RTOSPlugin_Zephyr.so  -singlerun -nogui
2. worth mentioning that i tried with and without -singlerun and in both cases it's the same result...
3. the west command line to compile includes: -DCONFIG_DEBUG_OPTIMIZATIONS=y -DCONFIG_DEBUG_THREAD_INFO=y 
4. the gdb command: arm-zephyr-eabi-gdb app/build/app/zephyr/zephyr.elf (ncs toolchain is on the path)
5. in gdb i use `target remote :2331`.
6. i set a breakpoints and use monitor reset and 'c' to continue. And the breakpoints is reached , however i cannot debug.
7. when using info threads i get just 1 thread and it's not true.
8. when trying 's' or 'n' it seems to stop the thread and restart it and not step in step out, i do not see the command executed and i do not get to the next command.

since you have disabled in VScode extension the debugger, can you please explain how i can debug a threaded app in GDB ?

my JLink version is: V7.98g, ncs version including toolchain is v2.7.0
I have tried advises from different places, but non actually helped, the only option currently is turn off the other threads...

  • Hi.

    Seems like you are right,

    i have copied my workspace to another location, removed everything but main.c in my /app directory, updated cmake and main.c to run an endless while loop with sleep and led 1 toggle, another thread is started and toggles another led and sleeps a different amount of time.

    started the gdb server like before and the arm-gdb as well.
    This time using info threads yielded 

    (gdb) info threads
      Id   Target Id                                    Frame 
    * 2    Thread 536877336 (main RUNNING PRIO 0)       main () at /home/eyal/develop/scms/staging_area/west_ws_1/nrf-connect-tondo/app/src/main.c:51
      3    Thread 536877120 (idle UNKNOWN PRIO 15)      0x00031222 in arch_cpu_idle () at /home/eyal/develop/scms/staging_area/west_ws_1/zephyr/arch/arm/core/cortex_m/cpu_idle.c:98
      4    Thread 536872464 (logging PENDING PRIO 14)   arch_swap (key=key@entry=0) at /home/eyal/develop/scms/staging_area/west_ws_1/zephyr/arch/arm/core/cortex_m/swap.c:49
      5    Thread 536877616 (sysworkq PENDING PRIO 255) arch_swap (key=key@entry=0) at /home/eyal/develop/scms/staging_area/west_ws_1/zephyr/arch/arm/core/cortex_m/swap.c:49
      6    Thread 536876840 (mcumgr smp QUEUED PRIO 3)  z_thread_entry (entry=0x2c209 <work_queue_main>, p1=0x20001728 <smp_work_queue>, p2=0x0, p3=0x0)
        at /home/eyal/develop/scms/staging_area/west_ws_1/zephyr/lib/os/thread_entry.c:37
      7    Thread 536872248 (thread1_id QUEUED PRIO 7)  z_thread_entry (entry=0x23bdd <thread1>, p1=0x0, p2=0x0, p3=0x0) at /home/eyal/develop/scms/staging_area/west_ws_1/zephyr/lib/os/thread_entry.c:37
    (gdb) si
    0x00023c36	51		ret = gpio_pin_configure_dt(&led, GPIO_OUTPUT_ACTIVE);
    (gdb) si
    0x00023c38	51		ret = gpio_pin_configure_dt(&led, GPIO_OUTPUT_ACTIVE);
    (gdb) si
    

    So the general setup seems to work, why i have an SMP thread, i have no idea, related to mcuboot i assume.

    SI and NI instructions work nicely, so i'm not sure what's causing an issue with our app.
    I'll keep this request open after i'll try again (we are in the middle of merges of features...)
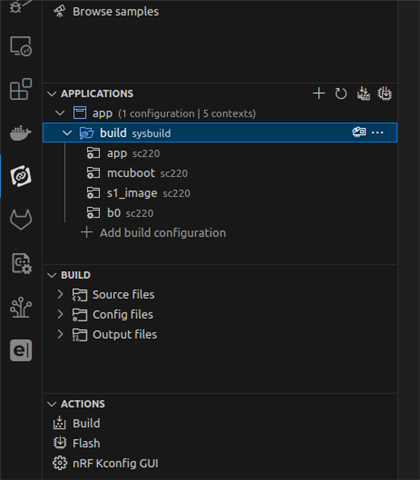
    I also have noticed (dunno if it's new or not) that now if in the nrf-connect extension page under applications -> app -> build i do not have debug, but if i go further to applications -> app -> build ->app (it's sys-build based west ws) then i do have both debug and debug with ozone, didn't test it yet but i have a hunch it will work, so if i'll update the runners yaml to include the zephyr rtos plugin it will work, ozone loads it automatically if it identifies rtos, so no need to update.

  • Hi,


    Glad to hear that the setup itself works as it should.

    Let me know if you still run into issues with your current firmware, and please provide a "bt" and "mon regs" output if that still does not give you your thread info.

    Eyal_Gal said:
    SI and NI instructions work nicely, so i'm not sure what's causing an issue with our app.
    I'll keep this request open after i'll try again (we are in the middle of merges of features...)
    I also have noticed (dunno if it's new or not) that now if in the nrf-connect extension page under applications -> app -> build i do not have debug, but if i go further to applications -> app -> build ->app (it's sys-build based west ws) then i do have both debug and debug with ozone, didn't test it yet but i have a hunch it will work, so if i'll update the runners yaml to include the zephyr rtos plugin it will work, ozone loads it automatically if it identifies rtos, so no need to update.

    It is similar to this, right?


    This is because sysbuild will append the image name inside the build-folder, as opposed to the partition manager.

    So now it will be build/$(IMAGE_NAME)/zephyr/ where the build files are located, as without sysbuild it is build/zephyr/


    Kind regards,

    Håkon

  • this is my setup, as yu can see when i'm on "app" i can see just build\flash operations, but if i go to a specific domain i can do more.

  • Hi,


    Eyal_Gal said:
    this is my setup, as yu can see when i'm on "app" i can see just build\flash operations, but if i go to a specific domain i can do more.

    Yes, this is the expected scenario and it is a side effect of sysbuild.

    Each image will have a dedicated build/$(image_name) catalog, where the root of the build-catalog will hold the merged image. To debug a specific target, you have to ensure that it is selected.


    Kind regards,

    Håkon

Related