This post is older than 2 years and might not be relevant anymore
More Info: Consider searching for newer posts
This discussion has been locked.
You can no longer post new replies to this discussion. If you have a question you can start a new discussion

Event to Event offset time smaller then specs show

Hi!

I'm having a little trouble with my measurements. A little situation sketch:

I'm using two nRF51822 DK's who act as peripheral and connect to a nRF51 Dongle that acts as central. The peripherals use application code that continuously changes (increments) a certain characteristic and sends notifications about that to the central. Because of that, the peripheral each send the max. number of packets per interval that the central allows to the central (in this case 3, cause this is what the newest firmware for the Dongle allows as max.), each packet containing a maximum of 20 bytes user payload of course. Both peripherals use HIGH BW configuration (both TX and RX), or in other words, the default setting.

The goal of this is to sniff the packet flow and prove that the provisioning of connection events happens according to the specs of the SoftDevice (s130 v2). According to those specs, I made some calculations. The tEEO should be 6.9 ms for both peripheral connection events because we are using HIGH BW configuration for both. So the minimal time between two events, each of another peripheral, should be 6.9 ms. This gives 6.9 + 6.9 = 13.8 ms as minimum boundary for the connection interval. This gives 15 ms as minimal connection interval. Using this interval, the situation was implemented. After both connections are established and the notifications from both peripherals are being send, the sniffer shows something like the figures below:

image description

image description

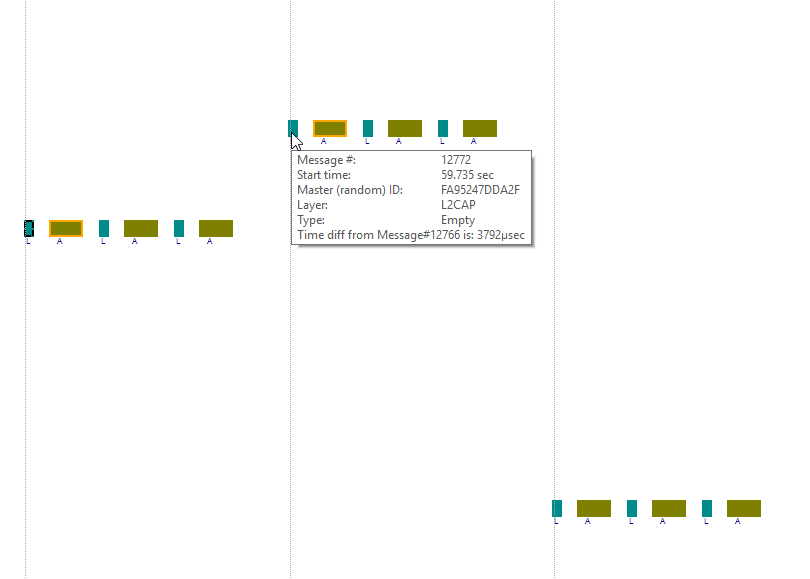
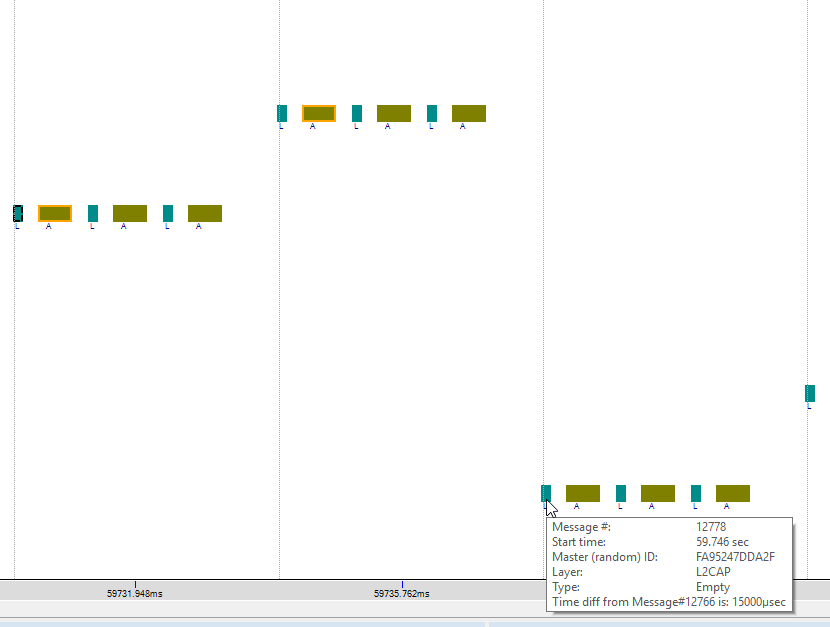
Now my question is: How is it that the time between the C0 and C1 event is 3.792 ms, which is far less then the theoretical minimum of 6.9 ms? The second figure is there to give a complete picture, showing that the next C0 event is indeed 15 ms away.

Thanks for your help in advance.

Gr

Mathias

  • I start to understand, my fault;) i was confused by your sniffer logs but these obviously map only single connection at the time, I need to imagine second connection running in parallel... You are trying to map situation of two simultaneous Central connections on nRF51 with S130 and you ask why second "slot" of synchronous links (= both have 15ms connection intervals) start ~3.8ms after the first one while it could start sooner? Isn't that irrelevant because it doesn't matter what is their shift, they both run independently and with max throughput they can get (if SD spec says 3 PDUs per interval then it is 3)?

  • No, I'm asking why it doesn't start later. Because with the HIGH BW configuration, the specs say the start time of the next should be minimum 6900 µs after the first one.

  • I see it in the table and could come up with theories but the best will be to wait for Nordic support guys later this week;)

  • Okay, thanks for the input already. And also for those slides, some interesting stuff in there that I didn't know yet :) I also would like to share that I don't always get 3 packets per interval, sometimes only 1 (in the same measurement) and sometimes some packet loss. I tested it again with a bit higher connection interval then the theoretical minimum (50 ms instead of 15 ms) and then I get good timing (larger then 6.9 ms in every case) and almost no packet loss (maybe one or two in a few seconds) and always 3 packets per interval for both peripherals. So maybe it has something to do with other factors that don't allow smooth flow with the theoretical minimum connection interval for this case, don't know.

  • What kind of bandwidth configuration do you have on the central device? If it is medium, doesn't this make sense? Since the tEEO of medium is 4025 us.

Related