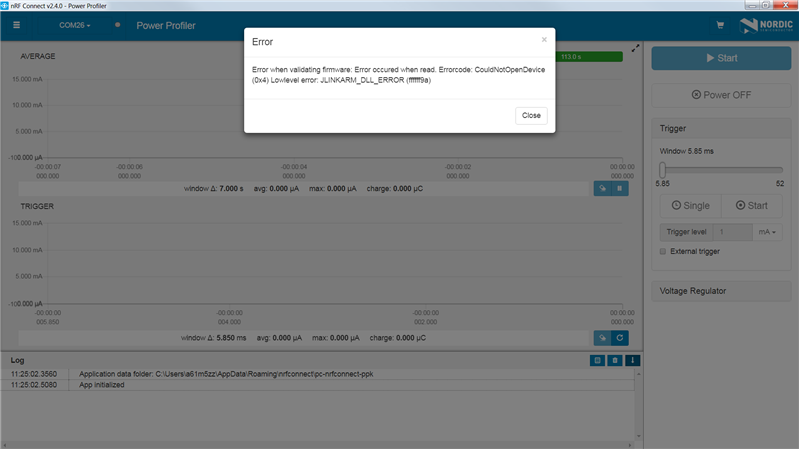
I am trying to measure the power consumption of a PCA10040 board while debugging, using the PPK. I am using the setup shown here: "Measuring current on nRF5 DK while debugging" with the slight change that I am using another PCA10040 board as JLink probe (as the nRF Connect v2.4.0 does not yet support a "real" JLink probe).
In detail, my setup is as follows. One PCA10040 board (naming this “DK A”) is connected with USB. The PPK is piggyback on DK A.
Another PCA10040 (“DK B”) is connected to the PPK with a 10 pin cable (Debug out on DK B is connected to Debug in on the PPK).
The COM SW3 is set to EXT.
SEGGER JLink version is V632i.
Steps to reproduce this problem
- Start a debugging session with IAR to DK A
- Start nRF Connect v2.4.0 Power Profiler and try to connect to DK B. This error message is given ("JLINKARM_DLL_ERROR (ffffff9a)"):

Another way to reproduce this
- Start nRF Connect v2.4.0 Power Profiler and to connect to DK B
- Start a debugging session with IAR to DK A
- This will kick the Power Profiler app out (the measurement stops). After this, it is impossible to connect to DK A with the app, showing the error message of step 2 above

