I am working on an nRF52832 BLE peripheral prototype which sends bulk data to a central as bursts of large notifications. I am encountering an error where the connection gets stuck - the peripheral keeps trying to send the same notification forever in an infinite loop, and calls to sd_ble_gatts_hvx return NRF_ERROR_RESOURCES. The devices will remain in this state forever - neither side crashes, and if the connection is lost the peripheral sees the disconnect event and resumes normal operation.
The problem is similar to the one in these questions:
My prototype application is running on:
- PCA10040 v1.1.1 board with nRF52832 rev 1
- SDK is nRF5_SDK_15.2.0_9412b96
- SoftDevice is S132 v6.1.0
- Toolchain is GCC ARM Embedded 6.3 2017-q2-update running on Windows 10
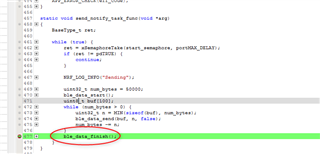
The application uses FreeRTOS. One task handles BLE stack events, and another task sends out notifications. It calls sd_ble_gatts_hvx in a loop until it returns NRF_ERROR_RESOURCES, and then blocks on an RTOS event flag. When the BLE_GATTS_EVT_HVN_TX_COMPLETE event arrives from the BLE stack, the event flag is set and it continues sending.
I have been able to reproduce the problem reliably, but only under very specific conditions: the central device is a nRF52 Dongle (PCA10059 with nRF52840), with pc-ble-driver-js 2.4.3 and a nodejs test script that I wrote, and the J-Link debugger is NOT connected to the PCA10040 peripheral device. The problem does NOT occur if any one of these changes are made to the test setup:
- Use a PCA10040 board to run the connectivity firmware instead of the PCA10059 dongle
- Put a long enough delay in between each call to sd_ble_gatts_hvx (40ms worked)
- Use the nRF Connect application instead of my nodejs test script as the central, with the PCA10059
- Use nRF Connect on an Android phone as the central
- Connect J-Link debugger to the peripheral
The effect of the J-Link is strange but repeatable: if the PCA10040 is plugged into the PC USB with no application connected to it, then the problem will occur. But if any J-Link application is running and connected to the debugger then the problem no longer occurs and everything works perfectly. This works with JLink.exe, JLinkRTTViewer.exe, and JlinkGDBServer.exe. I tried changing lots of random things in the project to try to figure out what effect connecting the debugger might have, but nothing worked: disable RTT logging, enable UART logging, request LFCLK and HFCLK, set CONSTLAT power mode, use SYSTICK instead of RTC for FreeRTOS, disable tickless idle, do not enable SCB_SCR_SLEEPDEEP. I assume there must be some kind of race condition somewhere and connecting the debugger makes some slight change to the timing?
I have attached a minimal test program that demonstrates the problem:
The peripheral is in the error_demo directory. To run, copy that directory to nRF5_SDK_15.2.0_9412b96\examples\ble_peripheral in the SDK and run "make flash" from nRF5_SDK_15.2.0_9412b96\examples\ble_peripheral\error_demo\pca10040\s132\armgcc (after flashing S132 SoftDevice). The test app advertises as a device named "ErrorDemo". When a central connects, after a 2 second delay it will start sending notifications from its custom service's characteristic if notifications are enabled. It sends a couple hundred notifications that contain about 50k of data total.
The central is in the error_demo_nodejs_client directory. I am running this under nodejs v8.12.0 (64-bit). First run "npm install". Then, edit errdemo.js. At the bottom fill in the COM port of your nRF52 dongle, and MAC address of your peripheral, then run "node errdemo.js". It will connect to the peripheral and print a debug message to the console for each notification it receives. It prints "Got the last notify" if it got all of them.
Using the version of the sniffer from this post I was able to capture logs of the failure:
This log shows the failure occurring:
pca10059_node_client_fail.pcapng
It starts out sending a few data notifications that are received successfully, the first is packet 1855 and the last good one is 1897. Then the problematic one is sent at 1899. The first odd thing happens at 1900, the master sends an empty PDU with SN 0 and NESN 1, maybe this should have been SN 0 and NESN 0? After this point the peripheral just keeps sending that notification from 1899 in an infinite loop.
This log shows everything working successfully, a couple hundred notifications are sent and then the connection becomes idle.
pca10059_node_client_success_with_jlink.pcapng
The only difference in the test setup between this log and the previous one is that JLinkGDBServer.exe was running and connected to the peripheral board.