
Hi everyone,
I have a problem with my custom nRF52832 hardware. I soldered my prototype hardware and then I checked if it is correct by checking debugger SW device settings in Keil. It was listed there. Then I started a JLink debugging session and suddenly there was an error "No Cortex-M SW Device Found*. Since then, the SD device is not listed anymore. No way to bring it back…
So I removed the processor and replaced it by a new one. Exact same behavior.
A colleague at work had the same problem. He soldered a new hardware and then everything was fine. Before I re-solder my hardware too, I want to ask here if someone had the same problem once?
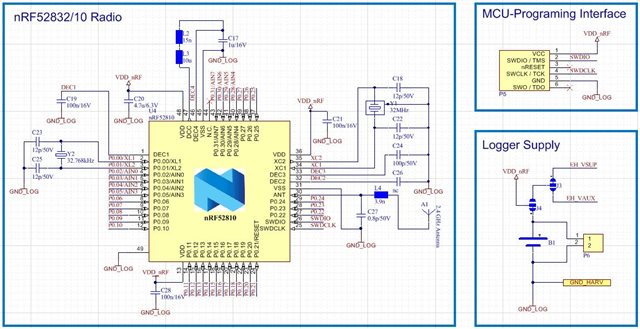
This is my hardware design:
Thank you very much for the help!
edit:
I'm also not able to connect over nrfjprog. I also tried with J-Link Commander V6.40 and this is the output:
SEGGER J-Link Commander V6.40 (Compiled Oct 26 2018 15:06:29)
DLL version V6.40, compiled Oct 26 2018 15:06:02

Connecting to J-Link via USB...O.K.
Firmware: J-Link EDU Mini V1 compiled Oct 26 2018 12:05:31
Hardware version: V1.00
S/N: 801005001
License(s): FlashBP, GDB
VTref=3.267V


Type "connect" to establish a target connection, '?' for help
J-Link>connect
Please specify device / core. <Default>: NRF52832_XXAA
Type '?' for selection dialog
Device>
Please specify target interface:
  J) JTAG (Default)
  S) SWD
  T) cJTAG
TIF>S
Specify target interface speed [kHz]. <Default>: 4000 kHz
Speed>
Device "NRF52832_XXAA" selected.


Connecting to target via SWD
Found SW-DP with ID 0x2BA01477
SWD speed too high. Reduced from 4000 kHz to 2025 kHz for stability
Found SW-DP with ID 0x2BA01477
Could not power-up debug power domain.
Scanning AP map to find all available APs
AP[0]: Stopped AP scan as end of AP map has been reached
Iterating through AP map to find AHB-AP to use
Found SW-DP with ID 0x2BA01477
Found SW-DP with ID 0x2BA01477
Could not power-up debug power domain.
Scanning AP map to find all available APs
AP[0]: Stopped AP scan as end of AP map has been reached
Iterating through AP map to find AHB-AP to use

****** Error: Could not find core in Coresight setup
Found SW-DP with ID 0x2BA01477
Found SW-DP with ID 0x2BA01477
Could not power-up debug power domain.
Scanning AP map to find all available APs
AP[0]: Stopped AP scan as end of AP map has been reached
Iterating through AP map to find AHB-AP to use
Found SW-DP with ID 0x2BA01477
Found SW-DP with ID 0x2BA01477
Could not power-up debug power domain.
Scanning AP map to find all available APs
AP[0]: Stopped AP scan as end of AP map has been reached
Iterating through AP map to find AHB-AP to use
Cannot connect to target.
J-Link>
And this is the output from another PCB with the exact same hardware on it, only the MCU is a nRF52810 this time.
I also made some experiments with the board from my collegue. It is not programmable and after random retries to do so, it goes into the same state and is no longer available. After some time, it is available again...

