This post is older than 2 years and might not be relevant anymore
More Info: Consider searching for newer posts

Delay between characteristics changing and connected device getting notification of that change

Hi folks,

I have a system basically working with the following setup:

#define MIN_CONN_INTERVAL               MSEC_TO_UNITS(7.5, UNIT_1_25_MS)      
#define MAX_CONN_INTERVAL               MSEC_TO_UNITS(7.5, UNIT_1_25_MS)       
#define SLAVE_LATENCY                   0      

I have a custom service with four characteristics that allow data to get from Nordic to PC (running Linux, not Windows or OSX) with handshaking in the following way:

PC Puts data in char1

Nordic gets new data and then:

Nordic writes value to char2 which tells the PC the Nordic has got the data and has enough space in its buffer for the PC to send more data. PC then pus updated version in char1 and so on...

The other two characteristics work for data being sent the other way.

Now, this works fine apart from the fact that there's a big old delay between data being put in a characteristic and the other end getting notification of that change. One problem is I don't know whether this is a delay between the Nordic picking up what the PC has changed or the PC picking up what the Nordic has changed.

I have put measurements at the PC end so I can tell that from a characteristic changed by the Nordic to tell the PC it is ready for more data it takes 140ms between updates. ie it is a round trip of 140ms, which is far too long!

Nordic writes to char2, PC updates char 1. Between the PC picking up that change in char2 and updating char1 there is less than a millisecond.

From the Nordic picking up the change in  char1 and putting a new value in char2 to twell the PC it can update char1 there is less than a millisecond.

So, there is either:

A delay in the soft device updating the characteristic after its API is called or:

A delay in the PC picking up the change in the characteristic or:

A delay in the PC from the application writing to the characteristic and it appearing "on air" or:

A delay in the soft device from picking up the change in char1 to sending it to my software running on the Nordic.

Or some combination of these. 

Are there any settings I have not tweaked that might be causing this? If so, what migt they be?

Can anyone think of anything I can do to track down exactly where the problem might be please? If I could toggle a pin on the PC when it picks up a change in char2 that might help I guess, but the days of parallel ports are long gone! ;)

Many thanks.

  • Sorry for the delay, been on other stuff.

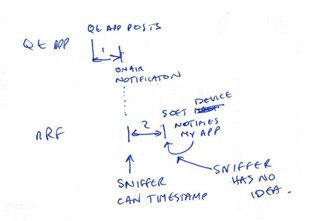
    OK, this first one hopefully shows what I mean. The Qt app (top left) posts an update to a characteristic. The sniffer can then see when that comes on air. However, the sniffer has no chance (as far as I can tell) of knowing when the soft device posts that value to my app or, indeed, when the soft device even first becomes aware of that characteristic change.

    Similarly the other way. My app on the nRF posts a change in the return characteristic, the sniffer can see that on air, but how does it know when the laptop running the Qt app has notification?

    btmon on the laptop might well have the same kind of info as the sniffer.

    I've tried a crude timeline above too to try and make the point.

    I know that the nRF app turns around quickly from getting a notification from the soft device, to posting a change in the "handshake" characteristic annd I know at the Qt end there is a similar fast turn around once the handshake characteristic change is detected and the Qt app posts the next packet of data.

    So, am I missing something? If not, are there any common gotchas for this kind of thing?

    Thanks! Slight smile

  • Hi,

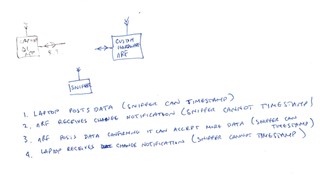
    To reiterate your notes from your first image:

    1. Laptop posts data (sniffer can timestamp)
    2. nRF receives change notification (sniffer cannot timestamp)
    3. nRF posts data (sniffer can timestamp)
    4. laptop receives change notification (sniffer cannot timestamp)

    I was under the impression that:

    • on the nRF side, 2. triggers 3., and this should happen as quickly as possible
    • on the laptop side, 4. triggers 1., and this should happen as quickly as possible
    • the round-trip, e.g. 1-2-3-4, or 3-4-1-2, is very long, but we do not know where it takes so long (e.g. is it the laptop or the nRF?)

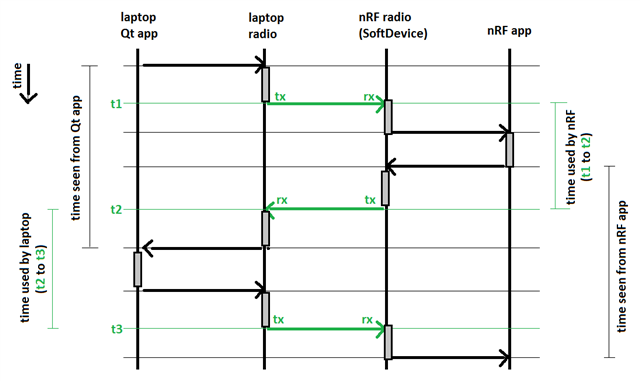
    With sniffer timestamps we can measure the time spent on either side from rx to tx on that side.

    In the below drawing, I have drawn the transmissions (visible to the sniffer) in green, and marked various time intervals. It is a bit simplified on the laptop side, since you probably have multiple layers in the stack there, but in any case there will be a delay between over-the-air traffic and logging (no matter how "far down in the stack" the logging happens.)

    The main point is: If we rely on software running on one of the sides, we do not know what portion of time is spent "between rx and tx on the other side", and what portion of time is spent "by radio software on the local side". With the sniffer log we know for sure what the "reaction time" is for each device.

    In addition to that, useful things in the sniffer log that I have not mentioned yet:

    • if link layer packets are resent
    • in the case of writes, if there is long writes (a value written to a characteristic is so long it gets sent with several packets)
    • what connection parameters are negotiated
    • +++ (basically we get an authoritative source for everything going on over-the-air.)

    Regards,
    Terje

  • Hi Terje,

    Sorry for the delay, holidays and getting dragged off to other things has delayed this.

    I suspect I am still missing something fundamental here. Sorry if I'm repeating myself and not explaining myself well here, but I just don't understand how this helps in seeing what goes on in the software on our custom hardware that has the Nordic device on it.

    How does the sniffer get into our custom hardware/software to see where these delays are happening? Do we have to have some sort of UART connection from our custom hardware to the sniffer? If not. the sniffer, surely, can simply see what's happening on the airwaves and not if our Nordic code is resending or putting in delays?

    What am I not understanding here?

    Thanks again and sorry if I'm being slow.

  • Hi,

    It is in order to see which side is responsible for the delays. Further debugging is next step.

    Regards,
    Terje

  • Hi Terje,

    I spent a couple of days installing the sniffer software (what a job that is!) and learning how to use Wireshark in this context, which is not easy either! :)

    I have used Wireshark on Ethernet several times and find it reasonably intuitive. However, I am not understanding this at all at the moment.

    So, if I post a characteristic on the laptop of 240 bytes, I can see that Wireshark is saying that is broken down into 17 (seventeen) discrete packets

    I have attached a pcap file. The first four packets seem right and are NOT part of the 240 byte characteristic. The first two constitute an arrow down command from the computer to the nrf and a response from the nrf to the computer to say got it, I'm ready for the next message,

    The next two packets are erase flash and get ready for a new firmware image, plus the ack to say instruction received. Packet 3 from computer to nrf, packet four from nrf to computer.

    The next seventeen is supposed to be one 240 byte characteristic with the first  chunk of a large binary file.

    I set a breakpoint in the computer's Qt code that is sending the new firmware image from the computer to the nrf at the point the computer gets the ACK from the nrf to say, please send me the next chunk,

    There are a whole host of questions with this:

    1. Why is the 240 byte characteristic not being seen as one entry in the pcap? It looks like it is being broken down into multiple packets. Is there a problem with how I'm sending out packets or is this an artefact/limitation of the sniffer? It looks to me like everything is coming in to Wireshark in 27 byte chunks or fewer. What is REALLY odd is that packet 5, although the chunk has 27 bytes, the first seven are not what I am sending out. This is, I suppose, likely to be somethign about LE I don't understand.

    The last four bytes of the 240 byte characteristic that is written, is  in packet  number 14 of length 30 - hex values of 21, 1d, 01, 08 whereas the chunks 5-13 are 20-27 byte

    2. Is the sniffer only capable of receiving 27 byte characteristics? This on the one hand seems likely given the 27 byte chinks of data in packets 5-13. On the other hand, that seems unlikely as if the sniffer could only handle 27 byte characteristics it would freak out  with a 240 byte example and just do nothing. I wondered whether the sniffer could only send certain sizes of data to Wireshark, but that's clearly not the case as packets 15-22 show.

    3. And then we come to 15-22. What are they? Why are they so much bigger, why are there so many CRC errors?

    4. Why am I not - with the sniffer - seeing a reply from the nrf to the computer to say ACK, send me the next packet? When I send single frame messages I see that ACK.

    I have attached a filtered pcap of what I am talking about here.

    TBH I am not clear how this really helps me still, but that's a question for when we've sussed ths out. Maybe this whole thing of characteristics not really being 240 bytes long is the crux of this.

    Many thanks for your help and patience, it is greatly appreciated.

    First Chunk Filtered.pcapng

Related