This post is older than 2 years and might not be relevant anymore
More Info: Consider searching for newer posts

Problems with k_free()

Hi,

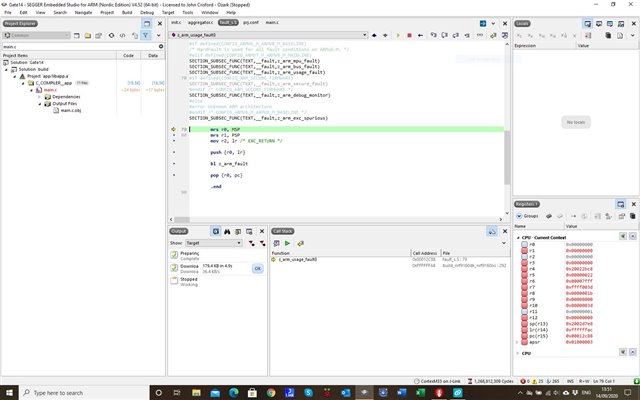
I can run the following code within main.c successfully, but it produces the error as shown in the attachment upon execution of k_free(mem.ptr)  from with aggregator.c. Any ideas why it is not working?

   char *mem_ptr;

   mem_ptr = k_malloc(200);

   if (mem_ptr != NULL) {

       memset(mem_ptr, 0, 200);

       printk("Memory allocated:");

      }

      else

      {

        printk("Memory not allocated:\n");

      }

    k_free(mem_ptr);

    printk("Memory released:\n");

  • With CONFIG_RESET_ON_FATAL_ERROR=n 

    Set in SPM and the ns part I have the following before it gets to k_free

    I'm happy to share the code with you, privately if possible.


    [0[00:04:15.576,477] [1B][1;31m<err> os: ***** USAGE FAULT *****[1B][0m
    [00:04:15.582,275] [1B][1;31m<err> os: Illegal load of EXC_RETURN into PC[1B][0m
    [00:04:15.589,202] [1B][1;31m<err> os: r0/a1: 0x20027490 r1/a2: 0x2002aa58 r2/a3: 0x00000000[1B][0m
    [00:04:15.598,114] [1B][1;31m<err> os: r3/a4: 0x40008000 r12/ip: 0x000003d6 r14/lr: 0x20020090[1B][0m
    [00:04:15.607,025] [1B][1;31m<err> os: xpsr: 0x00000000[1B][0m
    [00:04:15.612,365] [1B][1;31m<err> os: s[ 0]: 0x00000000 s[ 1]: 0x00000000 s[ 2]: 0x00000000 s[ 3]: 0x00000000[1B][0m
    [00:04:15.623,046] [1B][1;31m<err> os: s[ 4]: 0x00000000 s[ 5]: 0x00000000 s[ 6]: 0x00000000 s[ 7]: 0x00000000[1B][0m
    [00:04:15.633,758] [1B][1;31m<err> os: s[ 8]: 0x00000000 s[ 9]: 0x00000000 s[10]: 0x00000000 s[11]: 0x00000000[1B][0m
    [00:04:15.644,470] [1B][1;31m<err> os: s[12]: 0x00000064 s[13]: 0x00000000 s[14]: 0x00000000 s[15]: 0x000000a3[1B][0m
    [00:04:15.655,151] [1B][1;31m<err> os: fpscr: 0x00000010[1B][0m
    [00:04:15.660,522] [1B][1;31m<err> os: Faulting instruction address (r15/pc): 0x2002009c[1B][0m
    [00:04:15.668,609] [1B][1;31m<err> os: >>> ZEPHYR FATAL ERROR 0: CPU exception on CPU 0[1B][0m
    [00:04:15.676,605] [1B][1;31m<err> os: Current thread: 0x20027490 (unknown)[1B][0m
    [00:04:15.683,532] [1B][1;31m<err> os: Halting system[1B][0m

  • I ran it again.

    Got a more interesting result: after K_free executed

    Memory allocated:[00:09:10.317,321] [1B][1;31m<err> os: ***** HARD FAULT *****[1B][0m
    [00:09:10.322,998] [1B][1;31m<err> os: Fault escalation (see below)[1B][0m
    [00:09:10.329,406] [1B][1;31m<err> os: ***** BUS FAULT *****[1B][0m
    [00:09:10.334,991] [1B][1;31m<err> os: Precise data bus error[1B][0m
    [00:09:10.340,881] [1B][1;31m<err> os: BFAR Address: 0x1ffa2db0[1B][0m
    [00:09:10.346,923] [1B][1;31m<err> os: r0/a1: 0x20022bc8 r1/a2: 0x1ffa2db0 r2/a3: 0x00000000[1B][0m
    [00:09:10.355,834] [1B][1;31m<err> os: r3/a4: 0x0000090c r12/ip: 0x200228b4 r14/lr: 0x00026523[1B][0m
    [00:09:10.364,715] [1B][1;31m<err> os: xpsr: 0x81003800[1B][0m
    [00:09:10.370,056] [1B][1;31m<err> os: s[ 0]: 0x00000000 s[ 1]: 0x00000003 s[ 2]: 0x00000001 s[ 3]: 0x00000001[1B][0m
    [00:09:10.380,767] [1B][1;31m<err> os: s[ 4]: 0x00000001 s[ 5]: 0x00000001 s[ 6]: 0x00000001 s[ 7]: 0x00000001[1B][0m
    [00:09:10.391,448] [1B][1;31m<err> os: s[ 8]: 0x00000001 s[ 9]: 0x00000001 s[10]: 0x00000001 s[11]: 0x00000001[1B][0m
    [00:09:10.402,160] [1B][1;31m<err> os: s[12]: 0x00000001 s[13]: 0x00000001 s[14]: 0x00000001 s[15]: 0x00000001[1B][0m
    [00:09:10.412,841] [1B][1;31m<err> os: fpscr: 0x00000000[1B][0m
    [00:09:10.418,182] [1B][1;31m<err> os: Faulting instruction address (r15/pc): 0x0002625e[1B][0m
    [00:09:10.426,269] [1B][1;31m<err> os: >>> ZEPHYR FATAL ERROR 0: CPU exception on CPU 0[1B][0m
    [00:09:10.434,265] [1B][1;31m<err> os: Current thread: 0x20022b0c (unknown)[1B][0m
    [00:09:10.441,223] [1B][1;31m<err> os: Halting system[1B][0m

  • Hi,


    John said:
    Faulting instruction address (r15/pc): 0x0002625e[1B][0m

     This seems to be the culprit.

    You can use the tool "arm-none-eabi-addr2line -e build-folder/zephyr/zephyr.elf 0xFAULTINGADDR" to resolv an address to a specific line.


    John said:
    os: r3/a4: 0x0000090c r12/ip: 0x200228b4 r14/lr: 0x00026523[1B][0m

    Addresses starting from 0 and up to 0x100000 (1M) is flash mapped. 0x200????? is RAM mapped.

    RAM is usually not handled by the addr2line application, so in that case, you can have a look at the zephyr.map file to see what is happening.


    John said:
    os: Current thread: 0x20022b0c (unknown)[1B][0m

     If you check the .map file, you should see which thread/stack this memory belongs to.


    Kind regards,

    Håkon

  • If I do this the problem seems to evaporate and k_free doesn't fail.

    Should this be necessary to do ?

    Also should it be done in SPM as well ?

  • Or perhaps and easier way is CONFIG_MEM_POOL_HEAP_BACKEND=n in prj.conf

    However I'm unsure if this is the right thing to do.

Related