
Hi,
I want to program a nrf52832 module and a J-link debugger is on it's way. Until then I wanted to use my Black Magic Probe to flash and debug the application. I can successfully compile code on Windows 10 in Segger Embedded Studio (V5.34) and I can upload my binary with gdb:
target extended-remote COM7
monitor swdp_scan
attach 1
load binary.hex
mon hard_srst
detach
I wanted to automate the task and also doing debugging in the IDE, but I can only set the following:
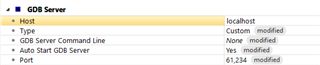
My question is: Can I somehow connect to my remote gdb server (COM7)?
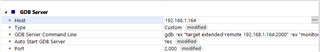
Edit: after posting this, I found out that I can run blackmagic app on my PC and now I can connect to my module through TCP from CMD:
gdb -ex "target extended-remote 192.168.1.164:2000" -ex "monitor connect_srst enable" -ex "monitor swdp_scan" -ex "att 1"
which returns:
Remote debugging using 192.168.1.164:2000
Assert SRST during connect: enabled
Target voltage: 2.09V
Available Targets:
No. Att Driver
 1      Nordic nRF52 M4
 2      Nordic nRF52 Access Port
Attaching to Remote target
warning: while parsing target description (at line 1): Target description specified unknown architecture "arm"
warning: Could not load XML target description; ignoring
0x00000001 in ?? ()
(gdb)
Now back to the Segger IDE:
No matter what I do, I get the following log:
write: $qSupported:vContSupported+#6c
read: $PacketSize=400;qXfer:memory-map:read+;qXfer:features:read+#1F
write: $vMustReplyEmpty#3a
read: $#00
write: $QStartNoAckMode#b0
read: $#00
write: $!#21
and on my gdb server:
Got connection
*** Unsupported packet: vMustReplyEmpty
*** Unsupported packet: QStartNoAckMode
Dropped broken connection: Connection reset by peer
And I'm stuck here, I don't know how to proceed.
Note: A few months ago I was able to flash and debug my application via gdb (tcp connection) in SES. My module was connected to a Raspberry Pi and I used OpenOCD.
Thank you in advance!

