Beware that this post is related to an SDK in maintenance mode
More Info: Consider nRF Connect SDK for new designs

Battery Service reading adc value from other GPIO

Hi everyone,

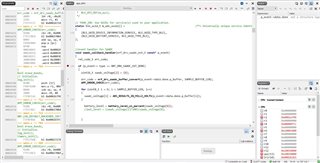
I have connected a potentiometer to a GPIO pin (AIN2) and would like to show the varying values in the battery service.

I was wondering if there's any way for me to amend the battery service so that the service can read other ADC/voltage value from other GPIO pins.

Tools:

  • nRF52832
  • nRF52DK
  • nRF5_SDK_17.1.0
  • 132 softdevice

Thanks,

Zachary

  • Hi Jared,

    thank you so much for your kind reply and patience with me. I apologise for my broken english and I'm rather new to Nordic.

    What I meant was when I supplied the board via the external supply or USB (which was powering less than 3V), the battery level should be less than 100% due to the "app_util.h" file, as it states that any voltage level that is less than 3V should not be 100%. (correct me if I'm wrong).

    Hence, I was puzzled when I supplied a 2.5V to the board via the external supply, the battery level in the application remains 100% or 0% after a couple of refreshes. Whereas, I've tried the "ble_app_proximity" example, the battery level reading were quite accurate. (E.g. 2.4V = 18%, 2.1V = 1%). The difference between the example and my code was the way we sample our adc reading. Will this affect how the battery service reads the voltage? 

    Can you set a breakpoint in saadc_callback_handler() and see what p_event->data.done.p_buffer[i] is? Is it constant?

    I've attached a screenshot the debug and breakpoint in saadc_callback_handler and I've realised that in the debugging terminal, no log was activated and there where no actions or errors while debugging. 

    I'm not sure if I've done it correctly, please advice me. 

    Once again, thank you for your kind reply and patience. I truly appreciate your time and effort. 

    Regards,

    Zachary

  • Zachary16 said:

    thank you so much for your kind reply and patience with me. I apologise for my broken english and I'm rather new to Nordic.

    What I meant was when I supplied the board via the external supply or USB (which was powering less than 3V), the battery level should be less than 100% due to the "app_util.h" file, as it states that any voltage level that is less than 3V should not be 100%. (correct me if I'm wrong).

    Hence, I was puzzled when I supplied a 2.5V to the board via the external supply, the battery level in the application remains 100% or 0% after a couple of refreshes. Whereas, I've tried the "ble_app_proximity" example, the battery level reading were quite accurate. (E.g. 2.4V = 18%, 2.1V = 1%). The difference between the example and my code was the way we sample our adc reading. Will this affect how the battery service reads the voltage? 

    I understand. When you supply 2V5 to the board externally, is the 5V USB still connected?

    Zachary16 said:

    I've attached a screenshot the debug and breakpoint in saadc_callback_handler and I've realised that in the debugging terminal, no log was activated and there where no actions or errors while debugging. 

    I'm not sure if I've done it correctly, please advice me. 

    Could you set the breakpoint at line 120, and check the value of p_event->data.done.p_buffer[i]? You can check it by adding it to watch:

    Note, that Softdevice applications requires you to restart the application after it has been paused. It will assert if you try to resume it. See this and this for more.

    regards

    Jared 

  • Hi Jared,

    Thank you for your reply.

    I understand. When you supply 2V5 to the board externally, is the 5V USB still connected?

    no, the USB was disconnect from the board.

    I've realised that the problem in my code was that the SAMPLE_BUFFER_LENS was at 5 hence causing the battery level to display only 0%.

    I have used the link that you provided earlier on and change the way I sample the adc. I changed SAMPLE_BUFFER_LENS to 1 and used oversampling and burst to give me a more accurate reading.

    Could you set the breakpoint at line 120, and check the value of p_event->data.done.p_buffer[i]? You can check it by adding it to watch:

    I have tried to do this however, it seems like the debugger did not stop at the breakpoint and the callback function is still running. I have attached a screenshot for reference.

    Could you kindly explain to me how debugging actually work? Does debugging only stops when there is an error in the code? and what information I can get from doing a debugging?

    regards,

    Zachary

  • Zachary16 said:
    I've realised that the problem in my code was that the SAMPLE_BUFFER_LENS was at 5 hence causing the battery level to display only 0%.

    Ok, so the problem is solved? What does the battery level show now?

    Zachary16 said:

    I have tried to do this however, it seems like the debugger did not stop at the breakpoint and the callback function is still running. I have attached a screenshot for reference.

    Could you kindly explain to me how debugging actually work? Does debugging only stops when there is an error in the code? and what information I can get from doing a debugging?

    Where is the breakpoint in the screenshot that you've shared? I was interested to see the value of p_event->data.done.p_buffer[i] when the callback handler is returned:

    Jared said:

    Could you set the breakpoint at line 120, and check the value of p_event->data.done.p_buffer[i]? You can check it by adding it to watch:

    See this for an explanation on debugging.

    regards

    Jared

  • Hi Jared, 

    Ok, so the problem is solved? What does the battery level show now?

    Yes, the problem have been partially solved. The problem i faced now is that every time I established a connection between the DK and nRF Connect App, the initial battery level (100%) will appear and only change the value after 20 secs (below 100% depending on the voltage input/adc reading). Is there a way that I can omit the 100% and allow the DK to show the accurate value immediately after connection. 

    Where is the breakpoint in the screenshot that you've shared? I was interested to see the value of p_event->data.done.p_buffer[i] when the callback handler is returned:

    Apologies for uploading the wrong image. I have attached a photo with the proper breakpoint.

    See this for an explanation on debugging.

    Thank you for sharing this link. I've watched this video hence, I've assume that the debugger will only stops if there's an error in the code. Whereas, during my trial of debug of my own code, the callstack will keep running and do not stop at the breakpoint. 

    Regards,

    Zachary

Related