how to decipher HARD FAULT / MPU FAULT on zephyr running on nrf52832

hello Nordic

i work on nrf52832, trying to run it with zephyr application

one board runs fine (more/less, there are some MPU FAULT issue that i am facing with no luck yet and i brought it up also in this, waiting for answer, thread: 

 performance issue with multi threadn in ncs with nrf52832 )

when i add another board i get the following fail :

ASSERTION FAIL [!arch_is_in_isr()] @ WEST_TOPDIR/zephyr/kernel/thread.c:622

  Threads may not be created in ISRs

[00000022] <err> os: ***** HARD FAULT *****
[00000022] <err> os:   Fault escalation (see below)
[00000022] [1;31m<err> os: r0/a1:  0x00000004  r1/a2:  0x0000026e  r2/a3:  0x00000000
[00000023] <err> os: r3/a4:  0x00000002 r12/ip:  0xa0000000 r14/lr:  0x0002f133
[00000023] <err> os:  xpsr:  0x6100000b
[00000023] <err> os: s[ 0]:  0x00000000  s[ 1]:  0x00000000  s[ 2]:  0x00000000  s[ 3]:  0x00000000
[00000024] <err> os: s[ 4]:  0x00000000  s[ 5]:  0x00000000  s[ 6]:  0x00000000  s[ 7]:  0x00000000
[00000024] [1;31m<err> os: s[ 8]:  0x00000000  s[ 9]:  0x00000000  s[10]:  0x00000000  s[11]:  0x00000000
[00000025] <err> os: s[12]:  0x00000000  s[13]:  0x00000000  s[14]:  0x00000000  s[15]:  0x00000000
[00000025] <err> os: fpscr:  0x00000000
[00000025] <err> os: Faulting instruction address (r15/pc): 0x000344f6
[00000025] <err> os: >>> ZEPHYR FATAL ERROR 0: CPU exception on CPU 0
[00000026] [1;31m<err> os: Fault during interrupt handling

[00000026] <err> os: Current thread: 0x200029d0 (unknown)
[00023642] [1;31m<err> fatal_error: Resetting system

my question is, how to decipher this log, how can i know from this lines where my problem is, which isr, which thread ?

hope to get help on this matter soon

best regards

Ziv

  • with both A and B

    A is a bit more urgent but B is crucial as well 

  • Hi,

    B:
    In your PROJECT/build/zephyr folder, there is a set of files.
    Sometimes it is useful to have a look at the zephyr.elf file, and find the Faulting instruction address.
    However, in my experience, these tools are more useful for debugging:
    1. Eventual error messages or asserts from the crash.
    2. Debugging functionality, see Our Debugging with VS Code tutorial.
    3. Using the printk function to debug.

    A:

    I will help you debug some then. Lets start with some questions.

    You say you get the error with one board, but not the other.
    Are the two boards different?

    If you try to reproduce the issue 10 times in a row, do you always get the same issue?

    Do you create your own ISR?
    If so, can you post the code of these (only the ISR)?

    Regards,
    Sigurd Hellesvik

  • hi Sigurd

    regarding B:

    Sometimes it is useful to have a look at the zephyr.elf file

    1. "the file is not displayed in the editor (vs code) because it is ether binary or uses an unsupported        

        encoding" that's the message i get when trying to see the zephyr.elf file

    2. sometimes when trying to start debug i get this in the debug terminal

        "Debugger requested to halt target..."

         and debugging does not start, seems like it is incapable to reset the device if it gets stuck or

         something like that, why is that and what can i do beside close the debug and try again

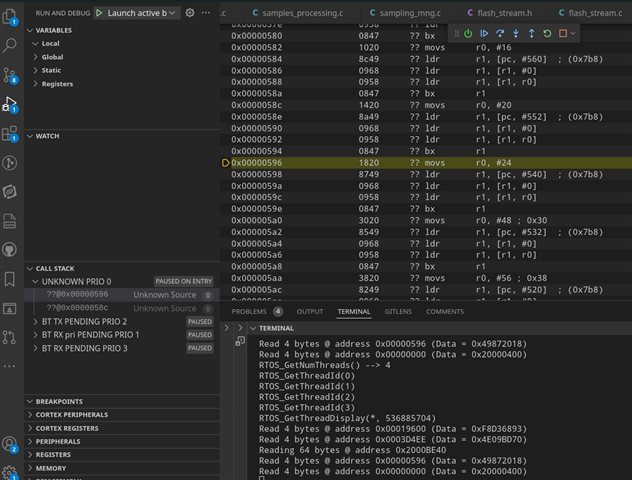
    3. my debug starts like this from assembly code, why is that, what can i learn from it, also there are unknown threads in the call stack as can be seen,

    how can i know which threads are those can/should/how do i give my threads names?

    and when i try to run i don't see anything change in my debugger but i see device is connecting and doing stuff so why ?

    regarding A:

    You say you get the error with one board, but not the other.
    Are the two boards different

    i did not write this, and for simplicity lets leave the other board.

    If you try to reproduce the issue 10 times in a row, do you always get the same issue?

    i have one board that has the following fails, on a certain operation at about 70% fail 30% works 

    the fail is the following:

     <inf> AUGU_SPI: nrfx_ppi_channel_alloc for spi: chan = 2
    [00000010] <err> os: ***** MPU FAULT *****
    [00000010] <err> os:   Stacking error (context area might be not valid)
    [00000010] <err> os: r0/a1:  0x974b1c56  r1/a2:  0xa9037e23  r2/a3:  0xfd7b35b1
    [00000010] <err> os: r3/a4:  0x04365cc4 r12/ip:  0x00000001 r14/lr:  0x00000000
    [00000010] <err> os:  xpsr:  0x81000000
    [00000010] [1;31m<err> os: s[ 0]:  0x00000000  s[ 1]:  0x00000000  s[ 2]:  0x00000000  s[ 3]:  0x00000000
    [00000010] <err> os: s[ 4]:  0x00000000  s[ 5]:  0x00000000  s[ 6]:  0x00000000  s[ 7]:  0x00000000
    [00000010] <err> os: s[ 8]:  0x00000000  s[ 9]:  0x00000000  s[10]:  0x00000000  s[11]:  0xffffffff
    [00000010] [1;31m<err> os: s[12]:  0x00000000  s[13]:  0x00000000  s[14]:  0x00000000  s[15]:  0xffffffff
    [00000010] <err> os: fpscr:  0x00000000[0m
    [00000010] <err> os: Faulting instruction address (r15/pc): 0x0003febc
    [00000010] <err> os: >>> ZEPHYR FATAL ERROR 2: Stack overflow on CPU 0
    [00000010] <err> os: Current thread: 0x20003200 (unknown)
    [00000011] <err> fatal_error: Resetting system
    *** Booting Zephyr OS build v2.6.99-ncs1-1  ***
    
    
    [00000016] <inf> AUGU_SPI: nrfx_ppi_channel_alloc for spi: chan = 2
    [00000017] <err> os: ***** MPU FAULT *****
    [00000017] <err> os:   Stacking error (context area might be not valid)
    [00000017] <err> os: r0/a1:  0xfd7b35b1  r1/a2:  0x04365cc4  r2/a3:  0x00000001
    [00000017] <err> os: r3/a4:  0x00000000 r12/ip:  0x00000000 r14/lr:  0xe000ed00
    [00000017] <err> os:  xpsr:  0x81000000[0m
    [00000017] <err> os: s[ 0]:  0x00000000  s[ 1]:  0x00000000  s[ 2]:  0x00000000  s[ 3]:  0x00000000
    [00000017] <err> os: s[ 4]:  0x00000000  s[ 5]:  0x00000000  s[ 6]:  0x00000000  s[ 7]:  0x00000000
    [00000017] <err> os: s[ 8]:  0x00000000  s[ 9]:  0x00000000  s[10]:  0x00000000  s[11]:  0x00000000
    [00000017] <err> os: s[12]:  0x00000000  s[13]:  0xffffffff  s[14]:  0x00000000  s[15]:  0x00000000
    [00000017] [1;31m<err> os: fpscr:  0x00000000
    [00000017] <err> os: Faulting instruction address (r15/pc): 0x000321b8[0m
    [00000017] <err> os: >>> ZEPHYR FATAL ERROR 2: Stack overflow on CPU 0
    [00000017] <err> os: Current thread: 0x20003200 (unknown)
    [00000017] <err> fatal_error: Resetting system
    *** Booting Zephyr OS build v2.6.99-ncs1-1  ***
    
    
    [00000008] <inf> AUGU_SPI: nrfx_ppi_channel_alloc for spi: chan = 2
    [00000009] <err> os: ***** MPU FAULT *****
    [00000009] <err> os:   Stacking error (context area might be not valid)
    [00000009] <err> os: r0/a1:  0x974b1c56  r1/a2:  0xa9037e23  r2/a3:  0xfd7b35b1
    [00000009] <err> os: r3/a4:  0x04365cc4 r12/ip:  0x20007742 r14/lr:  0x200073e0
    [00000009] <err> os:  xpsr:  0x81000000
    [00000009] <err> os: s[ 0]:  0x00000000  s[ 1]:  0x00000000  s[ 2]:  0x00000000  s[ 3]:  0x00000000
    [00000009] <err> os: s[ 4]:  0x00000000  s[ 5]:  0x00000000  s[ 6]:  0x00000000  s[ 7]:  0x00000000
    [00000009] <err> os: s[ 8]:  0x00000000  s[ 9]:  0x00000000  s[10]:  0x00000000  s[11]:  0x00000000
    [00000009] [1;31m<err> os: s[12]:  0x00000000  s[13]:  0x00000000  s[14]:  0x00000000  s[15]:  0xffffffff
    [00000009] <err> os: fpscr:  0x00000000
    [00000009] <err> os: Faulting instruction address (r15/pc): 0x0003feb2
    [00000009] <err> os: >>> ZEPHYR FATAL ERROR 2: Stack overflow on CPU 0m
    [00000009] <err> os: Current thread: 0x20003200 (unknown)
    [00000010] <err> fatal_error: Resetting system
    *** Booting Zephyr OS build v2.6.99-ncs1-1  ***
    
    
    [00000008] <inf> AUGU_SPI: nrfx_ppi_channel_alloc for spi: chan = 2
    [00000009] <err> os: ***** MPU FAULT *****
    [00000009] <err> os:   Stacking error (context area might be not valid)
    [00000009] [1;31m<err> os: r0/a1:  0x974b1c56  r1/a2:  0xa9037e23  r2/a3:  0xfd7b35b1
    [00000009] <err> os: r3/a4:  0x04365cc4 r12/ip:  0x00000001 r14/lr:  0x00000000
    [00000009] <err> os:  xpsr:  0x81000000
    [00000009] <err> os: s[ 0]:  0x00000000  s[ 1]:  0x00000000  s[ 2]:  0x00000000  s[ 3]:  0xffffffff
    [00000009] <err> os: s[ 4]:  0x00000000  s[ 5]:  0x00000000  s[ 6]:  0x00000000  s[ 7]:  0x00000000
    [00000009] [1;31m<err> os: s[ 8]:  0x00000000  s[ 9]:  0x00000000  s[10]:  0x00000000  s[11]:  0x00000000
    [00000009] <err> os: s[12]:  0x00000000  s[13]:  0x00000000  s[14]:  0x00000000  s[15]:  0xffffffff
    [00000009] <err> os: fpscr:  0x00000000
    [00000009] <err> os: Faulting instruction address (r15/pc): 0x0003feb2
    [00000009] <err> os: >>> ZEPHYR FATAL ERROR 2: Stack overflow on CPU 0
    [00000009] [1;31m<err> os: Current thread: 0x20003200 (unknown)
    [00000010] <err> fatal_error: Resetting system
    *** Booting Zephyr OS build v2.6.99-ncs1-1  ***
    
    
    [00000017] <inf> AUGU_SPI: nrfx_ppi_channel_alloc for spi: chan = 2
    [00000018] <err> os: ***** MPU FAULT *****
    [00000018] <err> os:   Stacking error (context area might be not valid)
    [00000018] <err> os: r0/a1:  0x974b1c56  r1/a2:  0xa9037e23  r2/a3:  0xfd7b35b1
    [00000018] <err> os: r3/a4:  0x04365cc4 r12/ip:  0x00000001 r14/lr:  0x00000000
    [00000018] <err> os:  xpsr:  0x81000000
    [00000018] <err> os: s[ 0]:  0x00000000  s[ 1]:  0x00000000  s[ 2]:  0x00000000  s[ 3]:  0x00000000
    [00000018] <err> os: s[ 4]:  0x00000000  s[ 5]:  0x00000000  s[ 6]:  0x00000000  s[ 7]:  0x00000000
    [00000018] <err> os: s[ 8]:  0x00000000  s[ 9]:  0x00000000  s[10]:  0x00000000  s[11]:  0x00000000
    [00000018] <err> os: s[12]:  0x00000000  s[13]:  0x00000000  s[14]:  0x00000000  s[15]:  0xffffffff
    [00000018] <err> os: fpscr:  0x00000000
    [00000018] <err> os: Faulting instruction address (r15/pc): 0x0003feb2
    [00000018] <err> os: >>> ZEPHYR FATAL ERROR 2: Stack overflow on CPU 0
    [00000018] <err> os: Current thread: 0x20003200 (unknown)
    [00000018] <err> fatal_error: Resetting system
    *** Booting Zephyr OS build v2.6.99-ncs1-1  ***
    
    
    # at restart
    [00000000] <inf> COMM_MNG: Bluetooth advertising started! duration = 30000
    [00000000] <err> os: ***** MPU FAULT *****
    [00000000] <err> os:   Stacking error (context area might be not valid)
    [00000000] <err> os: r0/a1:  0xfd7b35b1  r1/a2:  0x04365cc4  r2/a3:  0x00000001
    [00000000] <err> os: r3/a4:  0x00000000 r12/ip:  0x20003200 r14/lr:  0x00000000
    [00000000] <err> os:  xpsr:  0x81000000
    [00000000] <err> os: s[ 0]:  0x00000000  s[ 1]:  0x00000000  s[ 2]:  0x00000000  s[ 3]:  0x00000000
    [00000000] <err> os: s[ 4]:  0x00000000  s[ 5]:  0x00000000  s[ 6]:  0x00000000  s[ 7]:  0x00000000
    [00000000] <err> os: s[ 8]:  0x00000000  s[ 9]:  0x00000000  s[10]:  0x00000000  s[11]:  0x00000000
    [00000000] <err> os: s[12]:  0x00000000  s[13]:  0x00000000  s[14]:  0x00000000  s[15]:  0xffffffff
    [00000000] <err> os: fpscr:  0x00000000
    [00000000] <err> os: Faulting instruction address (r15/pc): 0x0003feb2
    [00000000] <err> os: >>> ZEPHYR FATAL ERROR 2: Stack overflow on CPU 0
    [00000000] <err> os: Current thread: 0x20003200 (unknown)
    [00000002] <err> fatal_error: Resetting system
    *** Booting Zephyr OS build v2.6.99-ncs1-1  ***

    and it sometimes fails on init at restart but maybe 5 or 10% fail out of 90-95% pass 

    Do you create your own ISR?
    If so, can you post the code of these (only the ISR)?

    not sure what you mean by create my own ISR, i implement interrupt handlers like in this case:

    void drdy_read_callback(void* ctx, uint8_t *rx_buff, int size)
    {
    	const struct device *iis_dev = (const struct device *)ctx;
    	struct iis3dwb_data *data = iis_dev->data;
    	static int run_idx = 0;
    
    	x_arrays[fill_sample_buff_idx][run_idx] = (uint16_t)(((uint16_t)(rx_buff[2]) << 8) | rx_buff[1] );
    	y_arrays[fill_sample_buff_idx][run_idx] = (uint16_t)(((uint16_t)(rx_buff[4]) << 8) | rx_buff[3] );
    	z_arrays[fill_sample_buff_idx][run_idx] = (uint16_t)(((uint16_t)(rx_buff[6]) << 8) | rx_buff[5] );
    	run_idx++;
    
    	curr_ts = nrfx_timer_capture_get(data->timer, 0);
    	if (0 != start_ts )
    	{
    		curr_diff = curr_ts - last_ts;
    		max_diff = (max_diff < curr_diff) ? curr_diff : max_diff;
    		min_diff = (min_diff > curr_diff) ? curr_diff : min_diff;
    		total_diff += curr_diff;
    		int_num++;
    		//nominal delta_t (based on ODR 26667HZ) is 37.5us
    		//the diff must be grater than 0.5*37.5
    		//the diff must be less than 1.5*37.5us
    		//the actual values are in timer ticks that is *16
    		if(curr_diff > 900)
    		{
    			bad_big_diff++;
    		}
    		else if(curr_diff < 300)
    		{
    			bad_small_diff++;
    		}
    	}
    	else
    	{
    		start_ts = curr_ts;
    	}
    	last_ts = curr_ts;
    
    	if( buffer_size <= run_idx )
    	{
    		run_idx = 0;
    		if ( true == app_buff_busy ) 
    		{
    			buff_overrun = true;
    			return;
    		}
    		int temp_idx = app_used_buff_idx;
    		app_used_buff_idx = fill_sample_buff_idx;
    		fill_sample_buff_idx = temp_idx;
    		app_buff_busy = true;
    		k_sem_give(&data->gpio_sem);
    	}
    }

    i also have spi_done handler and use enable ppi with timer to send spi request from a sensor

    i do open a thread by a function cal of "trigger_set" and let it close gracefully when sampling is done

    the thread open looks like so:

    void iis3dwb_init_thread(const struct device *dev)
    {
    	struct iis3dwb_data *iis3dwb = dev->data;
    
    #if defined(CONFIG_IIS3DWB_TRIGGER_OWN_THREAD)
    	k_sem_init(&iis3dwb->gpio_sem, 0, UINT_MAX);
    	sampling_on = true;
    
    	k_thread_create(&iis3dwb->thread, iis3dwb->thread_stack,
    					CONFIG_IIS3DWB_THREAD_STACK_SIZE,
    					(k_thread_entry_t)iis3dwb_sampling_thread, (void*)dev,
    					0, NULL, K_PRIO_COOP(CONFIG_IIS3DWB_THREAD_PRIORITY),
    					0, K_NO_WAIT);		
    
    #endif
    }

    and the thread itself:

    #ifdef CONFIG_IIS3DWB_TRIGGER_OWN_THREAD
    static void iis3dwb_sampling_thread(int dev_ptr, int unused)
    {
    	const struct device *dev = INT_TO_POINTER(dev_ptr);
    	struct iis3dwb_data *data = dev->data;
    	ARG_UNUSED(unused);
    	
    	k_sem_take(&data->gpio_sem, K_FOREVER);
    	buffer_size = CONFIG_IIS3DWB_FIFO_TH;
    	start_ts = 0;
    
    	while ( sampling_on ) 
    	{
    		app_buff_busy = false;
    		k_sem_take(&data->gpio_sem, K_FOREVER);
    		augu_sensor_stream_data_t trig_data;
    		trig_data.start_ts = start_ts;
    		trig_data.end_ts = last_ts;
    		trig_data.buff_size = buffer_size;
    		trig_data.x_buff = x_arrays[app_used_buff_idx];
    		trig_data.y_buff = y_arrays[app_used_buff_idx];
    		trig_data.z_buff = z_arrays[app_used_buff_idx];
    		trig_data.overrun = buff_overrun;
    		if (data->drdy_handler)
    		{
    			data->drdy_handler(dev, trig_data);
    		}
    	}
    }
    
    #endif

    any ideas ?

    hope to read you soon

    best regards

    Ziv

  • Hi Ziv,

    ziv123 said:

    1. "the file is not displayed in the editor (vs code) because it is ether binary or uses an unsupported        

        encoding" that's the message i get when trying to see the zephyr.elf file

    Sorry, I gave you the wrong file ending. I meant zephyr.lst.

    ziv123 said:
    why is that and what can i do beside close the debug and try again

    From your explanation, I am unsure what this could be. If trying again works, it seems like a workaround for now.

    ziv123 said:
    my debug starts like this from assembly code, why is that, what can i learn from it, also there are unknown threads in the call stack as can be seen,

    Try to add a breakpoint in the top of your main code, and "continue" the debugger until it breaks at the breakpoint.

    ziv123 said:
    the fail is the following:

    "[00000000] <err> os:   Stacking error (context area might be not valid)"

    From these error codes, it looks like a stack overflow. Try to increase CONFIG_IDLE_STACK_SIZE to for example 4096.

    Do you still get the error then?

    EDIT: Another tip on how to debug: I copied the "Stacking Error (context area might not be valid)" into DevZone search.
    Among others,  found this case. That case looks like it has multiple good tips on how to debug stack overflows. I suggest you have a look at it,

    Regards,
    Sigurd Hellesvik

  • hi Sigurd

    thanks, that was really helpful debugging tips, found the issue and added stack size for the failing thread:

    CONFIG_LOG_PROCESS_THREAD_STACK_SIZE=1024
    best regards
    Ziv
Related