Board reboots when a function is executed in TF-M

Hi,

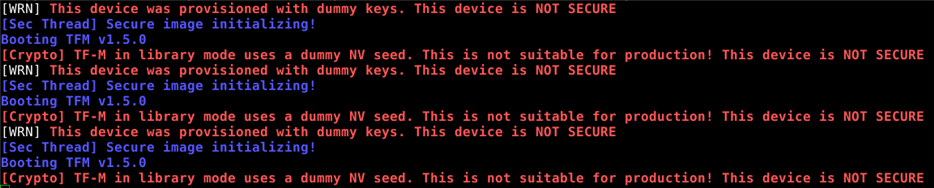
I'm moving a project from SPM to TF-M. I have imported a static library and the board (nRF5340DK) restarts automatically every time the following mycli/main.c function is executed: signature.

signature(pk, msg, buffer);

More specifically, the problem occurs when executing blst_sign_pk_in_g1 function, which is located in lib/bls_hsm.h.

blst_sign_pk_in_g1(&sig, &hash, secret_keys_store + pk_index*sizeof(blst_scalar));

Other functions from the static library are executed correctly, so I guess the problem is not in the import of the library, but must be related to memory. In case it is of any interest, a few weeks ago I had problems importing such a static library into TF-M. The problem was solved as indicated in the following forum ticket: Problem importing a library into TF-M: Not enough space to import i.

I attach a link to the github project repo, so that the error can be easily reproduced: bls-hsm-2. To reproduce the error, build and execute application mycli. You will see that the board reboots.

Thank you in advice,

Pablo

Useful information about the project:
- I'm using the nRF5340DK development kit.
- nRF SDK v2.0.0
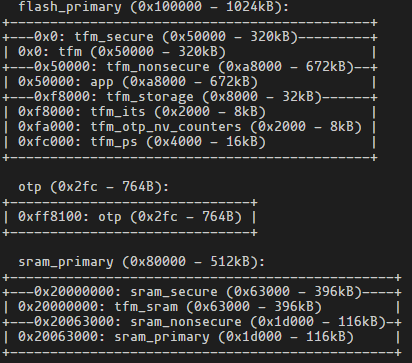
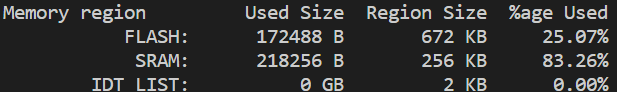
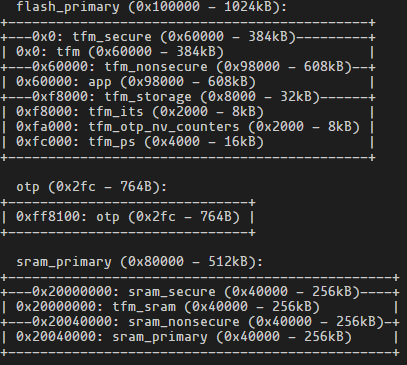
- The project is based on the example: TF-M Secure Partition Sample. When doing the build for this example, the available and used space shown is as follows:

Parents
  • Hi,

    I have reproduced your issue. I'll look into it more tomorrow.

    Best regards,
    Dejan

  • Hi,

    When doing the build for this example, the available and used space shown is as follows:

    I guess something is missing. I don't see anything after "follows:". Could you please resend what you wanted to send initially?

    Best regards,
    Dejan

  • Hi,

    I have looked into your project. I noticed that there are many warnings during build process. I would suggest you to go through these warnings and try to fix them. There seems to be a problem with your project that would need to be investigated further. 

    Could you provide more information on how you narrowed down the problem to the blst_sign_pk_in_g1 function from lib/bls_hsm.h?

    It would be beneficial if you could provide some logs. Could you show application log and secure partition log?

    Have you seen any hard fault errors?

    Bes regards,
    Dejan

  • I narrowed down the problem by doing a step-by-step debug. I found that it is in that line of code that the board reboot occurs.

    As for the warnings I get when doing the build, they don't seem to be related to the problem. I will still try to fix them

    Executing the following command inside bls-hsm-2/mycli, i get this log:

    west build -t partition_manager_report

    The reboot of the board made me think that it might be a RAM problem. To do so, I set the value of the RAM assigned to the safe partition to an extremely high value, by writing the following in prj.conf:

    CONFIG_PM_PARTITION_SIZE_TFM_SRAM=0x63000

    This did not solve the problem. Running the same command, having added this configuration inside prj.conf to the build gives the following log:

    Are them the logs you need?

    Regards,

    Pablo

  • Hi,

    I have a couple of updates about the project. 

    First of all, I have fixed some warnings that appear when doing the build. As I expected, this didn't solve the problem, but it's good to get rid of them.

    Secondly, I have added to the repository a branch called "non_secure", in which I have imported the static library and run the functions in the non-secure partition. The function that gives me problems in tf-m works correctly in non secure partition. To make it work, I have added the following configuration to prj.conf, to allocate spare memory to the main stack:

    CONFIG_MAIN_STACK_SIZE=104080

    Although I am not using the tf-m functions in this branch, I have not removed it from the configuration.

    When building, the following memory usage data is displayed:

    In case it is useful, this is the log obtained when executing the command:

    west build -t partition_manager_report

    Regards,

    Pablo

  • Hi,

    For which board did you build your sample?

    Did your build configuration include "Enable debug options"?

    Best regards,
    Dejan

  • Hi,

    I build for nrf5340dk_nrf5340_cpuapp_ns. My build configuration doesn't include 'Enable debug options'. Should I enable that?

    Regards,

    Pablo

Reply Children
  • Hi,

    I have tested your sample from non_secure branch and it was successful. I also tested your sample from the main branch and it still gives many warnings during the build process. Could you please remove the warnings from main branch?

    TF-M uses 2 UART interfaces for logging, one for secure part (TF-M and MCUboot) and one for the application. Documentation provides more information about logging. With regard to secure logging, you can refer to the TF-M logging section.
    Could you send both application and TF-M output logs with and without "Enable debug options"?

    Best regards,
    Dejan

  • Hi,

    I have removed the warnings that appeared when making the build. The problem has not been solved.

    I have made a build with and without the "Enable debug option" and another one with it enabled. In order to enable the "Enable debug options" option, I had to increase the TF-M size. It is 0x50000 without enabling the option and 0x60000 by enabling the option. This can be checked in the prj.conf file.

    Again, I show what you get when you run the following command

    west build -t partition_manager_report

    Build without debug options enabled:

    Build with debug options enabled:

    It is not clear to me which logs you need, so I would be grateful if you could specify which ones you need if they are not the ones I have given you.

    Regards,
    Pablo

  • Hi Pablo,

    The first log is ordinary UART application log. If UART logging is enabled in your application, you could use any terminal emulation program to see the log as shown in testing and debugging application. To see application log, you would need to connect to COM port corresponding to the application (VCOM1 in VS Code).

    As mentioned before, documentation explains TF-M logging. I'll provide more details here. If you want to see TF-M log, you would need to take log from UART1. If you have 2 nRF5340-DKs (v2.0.0), you could connect them together to get required logs. First, flash the project to the first DK (DK-A) and recover the second board (DK-B). Connect pins P0.25 and P0.26 on DK-A to pins P1.00 (RXD) and P1.01 (TXD) on DK-B. Using terminal emulation program, connect to the COM ports on both devices. One of the COM ports (VCOM1 in VS Code) on the DK-A will show the application log and one of the COM ports (VCOM0 in VS Code) on DK-B will show the TF-M log.

    In case that you have only one nRF5340-DK board, you could connect USB to serial converter cable directly to the DK-A using pins P0.25 and P0.26. You would then have 2 COM ports and 1 USB port open. You could then connect to the second VCOM port (VCOM1) shown in VS Code to see application log and to the COM port which corresponds to UART Serial port to see TF-M log.

    Best regards,
    Dejan


  • Hi Dejans,

    I have connected pins P0.25 and P0.26 to a USB-to-serial converter and managed to get the TF-M log. Here are the logs obtained from TF-M and the application output:

    Without "enable debug options"

    Application output

    TF-M log

    With "enable debug options"

    Application output

    TF-M log

    It seems to be no difference whether the "enable debug configuration" option is enabled or not. I would like to remind you that the board restarts automatically when the error occurs. This is the reason why you see the same thing 3 times in each log image.

    I have not been able to observe any log of the application, from the non-secure partition. My understanding was that I should see it in VCOM1 in VS Code. I have also tried using PuTTY, and got nothing. I also tried with VCOM0, but nothing happened. VCOM2 is the application output.

    I thought that, maybe, there was nothing to show this log. Therefore, I tried adding the following configuration:

    CONFIG_LOG_PRINTK=y

    This should dump the printk messages from my code to the log. However, I still couldn't manage to see those messages in the log.

    Note: I get the TF-M log output from a linux virtual machine, as I was having problems with my USB-to-serial converter drivers. So I tried to look at the application's log from there, but I didn't get any result either.

    I will keep trying to get the application log. If I succeed, I will post it on the forum. Meanwhile, this is all I have.

    Regards,
    Pablo

  • Hi Pablo,

    Thank you for the logs. I have tested your sample (from main) using NCS v2.0.0, nRF5340-DK and Windows 10, but I could not reproduce your issue. I didn't get any board resets. You could try using system without virtual machine.

    Best regards,
    Dejan

Related