nRF52840 app not sleeping, SoftDevice seems involved

Hello-

I'm seeing the nRF52840 stay awake when I don't want it to. I'm calling sd_app_evt_wait() every turn through the main loop with SEVONPEND disabled, but it's waking up and falling through.

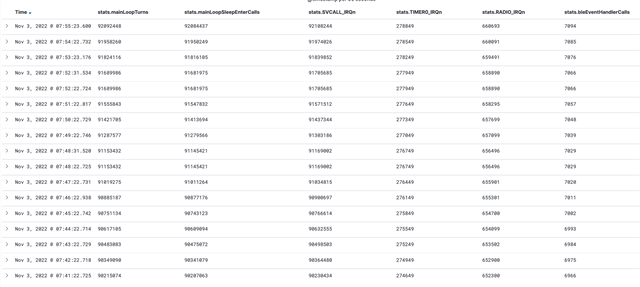
I'm capturing a histogram of the entire IRQ set, now including the 16 core exceptions, and I found a "smoking gun"- There's almost a 1:1 correspondence between my main loop turns and the core SVCALL_IRQn exception interrupt:

Reading the nRFSDK / SoftDevice headers, it looks like there's a syscall-style interface- when calling from the app into SoftDevice, it issues the SVC with the call id encoded in the instruction.

My hunch about what's happening here is that I've managed to get my app into a state where it's calling into SoftDevice (maybe to test something?) once per main loop turn. That issues an SVC, which sets the Event register. Then, when I call into sd_app_evt_wait() at the end of my loop, it clears the Event register and simply continues. The cycle repeats again, and my app never sleeps.

So, here are some questions I was hoping an expert could give me some advice + insight into please!

1. Is my hypothesis reasonable? Could this be happening? Does SVC set the Event register?

2. Is there anything in the nRFSDK that lets me audit SoftDevice supervisor calls in an automated way? (I think I can build this into my IRQ capture-and-forward shim)

3. Do you have any other ideas or suggestions?

Sorry to file a relatively open-ended question, but time is critical for us so I'd love any thoughts you all might have!

Best,

Charles

  • Thanks for the response. Because this is is very hard to reproduce, I'm looking for ways to gather more clues from units in the field.

    Another question- if I have a BLE central connect and hold a very fast connection interval, 7.5ms, could that cause behavior like this? sd_app_evt_wait() seems like it doesn't return to my code from radio/timer0/rtc0 interrupts, but I'm curious if it's possible.

    I'm seeing ~100k+ main loop runs per minute, is the only option left that I actually have an interrupt firing that many times (kilohertz range)? I'd expect to see it on my IRQ histogram (see initial post) but I don't.

  • Hi Charles, 
    Is there any chance that it's locked up somewhere and couldn't enter sd_app_evt_wait() ? 

    Short interval of 7.5ms shouldn't be a problem. The BLE activity only takes from 2ms for an connection event. And if there is no BLE activity that requires the app involvement sd_app_evt_wait() will not return because of the BLE activity. 


     Could you give me some more info about the softdevice ? Which version are you using ? 

  • I'm incrementing a counter every time I turn through my main loop, and I'm incrementing a separate counter every time I call sd_app_evt_wait(), and I'm incrementing a counter per-IRQn (all of them, via an assembly VTOR shim that intercepts all interrupts), so I can see all of the softdevice interrupts as well.

    Note that the number of SVCALL interrupts is almost identical to the number of calls to sd_app_evt_wait(), which is also almost identical to the number of main loop turns.

    This data tells me that I am regularly calling my main loop, and that I am also regularly calling sd_app_evt_wait(), and I'm not blasting SoftDevice with other calls.

    Please look to my first and second posts in this thread to observe the data that I've captured; perhaps something will jump out at you? 

    If I had some other high-frequency interrupt occurring, I'd expect to see it in my table above.

    I'm using nRFSDK 17.0.2, SD140 7.0.1, nRF52840.

    Also; I'm explicitly _clearing_ SEVONPEND, is it possible that disabled-but-pending interrupts are somehow contributing to wake?

  • (btw the IRQn shim thing isn't causing the wakeups; I wrote the IRQn shim thing in an attempt to gather data to diagnose and fix the issue :) )

  • Hi Charles, 

    Thanks for the explanation about the IRQ histogram I wasn't sure what it was earlier.

    So you have a counter on each of the IRQ handler and in the main loop.

    Could you explain why there is a different of the counter between MainloopTurns and mainloopSleepEntercalls ? 

    charles_fi said:
    Note that the number of SVCALL interrupts is almost identical to the number of calls to sd_app_evt_wait(), which is also almost identical to the number of main loop turns.

    I think the above behavior is true for any application, that the number of SVCall is almost identical to sd_app_evt_wait() and to the number of the main loop turns. It's how it should be, isn't it ? 

    The question here is only on why it waking up so often. As I can see from the table it's about 2230 times per second. 

    It doesn't ring any bell for us. It's too fast to be any BLE activity. And without more detail or profiling it's not possible to tell what could be the culprit here. 

    I assume you only managed to record the histogram once ? If you can reproduce the issue again you either using the power profiler or can think of toggling a GPIO in the main loop so that it's easier to visualize the wake up behavior. 

    Do you have any other activity for example UART logging , RTT, ADC ? anything else that can involve ? Can you share the source code ? You can convert the case to a private case to share the code if needed. 

Related