

Out of the box, the examples in the nRF Connect SDK are configured for ease of use, functionality, and debugging; they are not generally configured for optimal memory utilization. Some of the examples are simply too large to fit in Nordic’s smallest memory footprint components and need to be modified before use. Beyond the examples, memory optimization should be on every embedded developer’s production code checklist. Minimizing compiled code size could allow your product to use a smaller memory footprint, the largest driver of microcontroller cost, and will shrink the size of firmware images reducing product lifetime data costs. To this end, the nRF Connect SDK is highly configurable with literally thousands of configuration options covering a huge array of functionality. Many configuration options are set for you by the Zephyr build system when you select a board target for development at compile time, like whether a device has a specific peripheral, which UART is used for logging, etc. You can see the list of generated kConfig options in the build folder for any nRF Connect SDK project in a file …build\zephyr\misc\generated\configs.c which is easily accessible in Nordic’s Visual Studio Code environment under input files. That’s interesting, but it’s a long list of cryptically named options. If you were looking to optimize a project, where would you start in this list or in the larger list of available options?
This blog post intends to answer that question generally and provide some pointers on how to go about optimizing your project. There are two pieces of memory we need to optimize: non-volatile, which could be Flash or other memory, internal or external, and RAM. Zephyr provides a tool, the Thread Analyzer, for optimizing RAM usage of RTOS features. There are also samples that contain code designed to guide you on optimization of BLE functionality. First, we’ll look at how to configure a project for minimum compiled program size and then we’ll look at the Thread Analyzer tool for how to minimize RAM consumption. By the end, you’ll understand how to approach optimization of your custom projects.
How to Create an Alternate Configuration
When optimizing non-volatile memory, there are important notions to consider. One set of optimizations take place in the compiler to reduce the compiled size of your application. At another level, there is optimization of the build to minimize the amount of unnecessary code in your project. The code to be removed may have been included to add functionality not required in the final product, like for debugging and logging. Also, substantial portions of the BLE stack may not be required for your product and can be left out. With the Zephyr SDK, you may use any number of configuration files in your project to create infinite variants, repurposing the code for different builds, tests, or products. All nRF Connect SDK projects must include a prj.conf file which is used as the default configuration file unless an alternate is specified. If you would like to substitute a configuration file for the default, you must pass a configuration flag to CMake for the build. The flag is “-DCONF_FILE=’my_alt_prj.conf’ and it can be passed appropriately to the build system depending on whether you are using the command line, Segger Embedded Studio, or Visual Studio Code. If you’re using the command line and have already navigated to your build folder, you would use simply add “-- -DCONF_FILE=my_alt_prj.conf” to the end of your build command. If you’re not using the command line, please see this page for instructions on setting compiler flags. So, this is an approach for making alternate builds. Another option to modify the project configuration are overlay files, which I will leave to the reader to explore. Let’s see what we should change in the alternate configuration.
Configuration Options for Flash Optimization
The nRF Connect SDK contains two example projects with alternate minimal configurations: the peripheral_lbs and peripheral_uart projects. Each of these projects contains a basic prj.conf file, like the other examples, but additionally includes a prj_minimal.conf for illustration purposes. Go ahead and navigate to the peripheral_lbs example and let’s compare the prj.conf file with the prj_minimal.conf file to see the differences between the configurations. The prj.conf file is short and looks to be pretty minimal itself but we know that there are many default configuration options automatically turned on by the Zephyr build system. The prj_minimal.conf file illustrates just how many options were enabled by default in showing how to turn them off. Let’s look at a few of them. Here are the some of the options in the prj_minimal.conf file:
# Drivers and peripherals
CONFIG_I2C=n
CONFIG_WATCHDOG=n
CONFIG_GPIO=n
CONFIG_PINMUX=n
CONFIG_SPI=n
CONFIG_SERIAL=n

# Power management
CONFIG_PM=n

# Interrupts
CONFIG_DYNAMIC_INTERRUPTS=n
CONFIG_IRQ_OFFLOAD=n

# Memory protection
CONFIG_THREAD_STACK_INFO=n
CONFIG_THREAD_CUSTOM_DATA=n
CONFIG_FPU=n

# Boot
CONFIG_BOOT_BANNER=n
CONFIG_BOOT_DELAY=0

# Console
CONFIG_CONSOLE=n
CONFIG_UART_CONSOLE=n
CONFIG_STDOUT_CONSOLE=n
CONFIG_PRINTK=n
CONFIG_EARLY_CONSOLE=n

# Build
CONFIG_SIZE_OPTIMIZATIONS=y

# ARM
CONFIG_ARM_MPU=n
Some of these options will not save a huge amount of space and may be essential to your application, but some of them are not critical to include in your production build. Logging should be the first thing to go and, in general, takes up quite a bit of code space with print statements, hardware drivers, protocols, etc. So, there are a quite a few options related to cutting out logging. From there, default hardware drivers are also removed: SPI, I2C, and GPIO along with default Zephyr options. Skipping ahead to the bottom of the prj_minimal.conf file, we see the minimization of BLE options. Here’s what that looks like:
# Disable Bluetooth features not needed

CONFIG_BT_DEBUG_NONE=y
CONFIG_BT_ASSERT=n
CONFIG_BT_DATA_LEN_UPDATE=n
CONFIG_BT_PHY_UPDATE=n
CONFIG_BT_GATT_CACHING=n
CONFIG_BT_GATT_SERVICE_CHANGED=n
CONFIG_BT_GAP_PERIPHERAL_PREF_PARAMS=n
CONFIG_BT_SETTINGS_CCC_LAZY_LOADING=y
CONFIG_BT_HCI_VS_EXT=n

# Disable Bluetooth controller features not needed
CONFIG_BT_CTLR_PRIVACY=n
CONFIG_BT_CTLR_PHY_2M=n

# Reduce Bluetooth buffers

CONFIG_BT_BUF_EVT_DISCARDABLE_COUNT=1
CONFIG_BT_BUF_EVT_DISCARDABLE_SIZE=43
CONFIG_BT_BUF_EVT_RX_COUNT=2
CONFIG_BT_CONN_TX_MAX=2
CONFIG_BT_L2CAP_TX_BUF_COUNT=2
CONFIG_BT_CTLR_RX_BUFFERS=1
CONFIG_BT_BUF_ACL_TX_COUNT=3
CONFIG_BT_BUF_ACL_TX_SIZE=27
Looking at these options, some of them have the names of various optional BLE features, like GATT Caching and are self-explanatory if you’re familiar with BLE. Some of them are more cryptic and set with seemingly arbitrary numbers, so I counsel caution in editing these settings and please do check with your local FAE or the DevZone. We won’t go into all the details of each of these options, leaving it to the reader to pursue.
So what results does this configuration yield? Compiling this project with the stock prj.conf file and comparing it to the build with the minimal file, this configuration file reduces the project flash from 174kB down to 136kB, when built for the nRF52840.
Now let’s look at RAM optimization with the Thread Analyzer.
RAM Optimization with the Thread Analyzer
The Zephyr RTOS contains a useful optimization utility called the Thread Analyzer which provides runtime statistics about RTOS threads, particularly RAM utilization by showing the size of the stack for each thread along with the CPU utilization of the tasks. The Thread Analyzer tool is very easy to add to your application requiring only modification of the project prj.conf file. Once you add the requisite commands, the application will spit out information at regular intervals so you can tune your memory consumption, catch overflows, and watch resource utilization. To add the Thread Analyzer to your application, add the following lines to your prj.conf file.
CONFIG_THREAD_NAME=y
CONFIG_THREAD_ANALYZER=y
CONFIG_THREAD_ANALYZER_AUTO=y
CONFIG_THREAD_ANALYZER_RUN_UNLOCKED=y
CONFIG_THREAD_ANALYZER_USE_PRINTK=y
CONFIG_CONSOLE=y
CONFIG_UART_CONSOLE=y
CONFIG_SERIAL=y
CONFIG_PRINTK=y
There are a variety of options that you can set and are being set here. You can configure how the Thread Analyzer output comes, whether over UART or RTT, and how often the output is generated also. We won’t go into all the options here. The above is the minimum to get output over UART. Let’s take a look at what that output looks like. Below is the Thread Analyzer output from the peripheral UART application we have been looking at. This is the stock application without any optimizations.
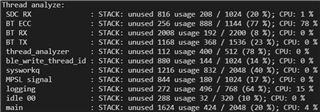
Looking at this output, we can see that there are some threads that have been allocated much more memory than they are actually using. Before just making changes at random to this file and whittling the memory usage down to the bare minimum, there are some things we need to think about. The image above has captured some period of time running near the beginning of the application. It’s not connected, not receiving or sending any information, so we can’t assume that these numbers are the maximum numbers. It’s necessary to put the application through its paces, monitoring RAM usage real-time through all of the application’s routines that matter. If you cut these numbers all the way down, you will see memory faults, stack overflows, and crashes. So, it’s always a good idea to maintain at least a little bit of margin. How much is up to you and how badly you need to reduce it. Also remember that this is the stack of the thread so variables, their size, and how they are declared are all contributors to RAM consumption. Anyway, to trim these stack sizes down, we use more kConfig commands. Looking in the prj_minimal.conf from before, we see that the default minimal configuration has some suggested parameters and they are configured like so:
CONFIG_SDC_RX_STACK_SIZE=324
CONFIG_BT_RX_STACK_SIZE=1024
CONFIG_BT_HCI_TX_STACK_SIZE_WITH_PROMPT=y
CONFIG_BT_HCI_TX_STACK_SIZE=640
CONFIG_SYSTEM_WORKQUEUE_STACK_SIZE=256
CONFIG_MPSL_SIGNAL_STACK_SIZE=256
CONFIG_MAIN_STACK_SIZE=640
CONFIG_IDLE_STACK_SIZE=128
CONFIG_ISR_STACK_SIZE=1024
CONFIG_BT_NUS_THREAD_STACK_SIZE=512
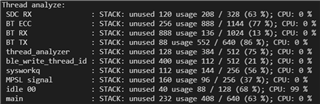
The names are fairly self-explanatory as these statements configure the stack for standard threads that run in nRF Connect SDK samples. You can use similar statements and Zephyr functionality to configure the thread stack size for your custom threads. After adding these configuration options to the application, the output below is generated by the Thread Analyzer. You can see that RAM has been dramatically reduced and overall RAM utilization numbers are higher.
That’s about all there is to it. Do reach out for help to the DevZone or your local FAE for further assistance and guidance for your particular application.