Preparing firmware for a major product launch is never easy, especially when unexpected reboots and crashes start appearing. Traditional debugging methods – manually collecting logs, reproducing issues on a bench setup, and plenty of trial and error – can be slow and frustrating. While gearing up for the Thingy:91 X launch, our firmware team at Nordic encountered issues during field testing, and we needed a better way to get to the root cause. With Memfault, we were able to systematically identify and resolve memory leaks, modem crashes, and connectivity issues without the usual guesswork. Having real-world diagnostics at our fingertips made a huge difference in streamlining our debugging process and gave us confidence leading up to the Thingy:91 X launch this past fall. In this article, I’ll walk through some of the issues that came up and the important instrumentation that led to diagnosis.
Table of Contents
Hunting down a memory leak
Memory leaks can be brutal to track down. They tend to creep up over time, slowly eating away at available memory until, eventually, the device runs out and crashes. We ran into exactly this problem in the field when running tests on our Thingy:91 X firmware. Devices started crashing unexpectedly and we didn’t know why.
In Memfault, we looked at a particular device that was in this field test group, and inspected the device behavior leading up to the crash. Memfault gathers metrics periodically on the device and charts them on a timeline to allow us to detect correlations in behavior. In this case, we saw a clear relationship between the built-in Heap_BytesFree metric and resets:
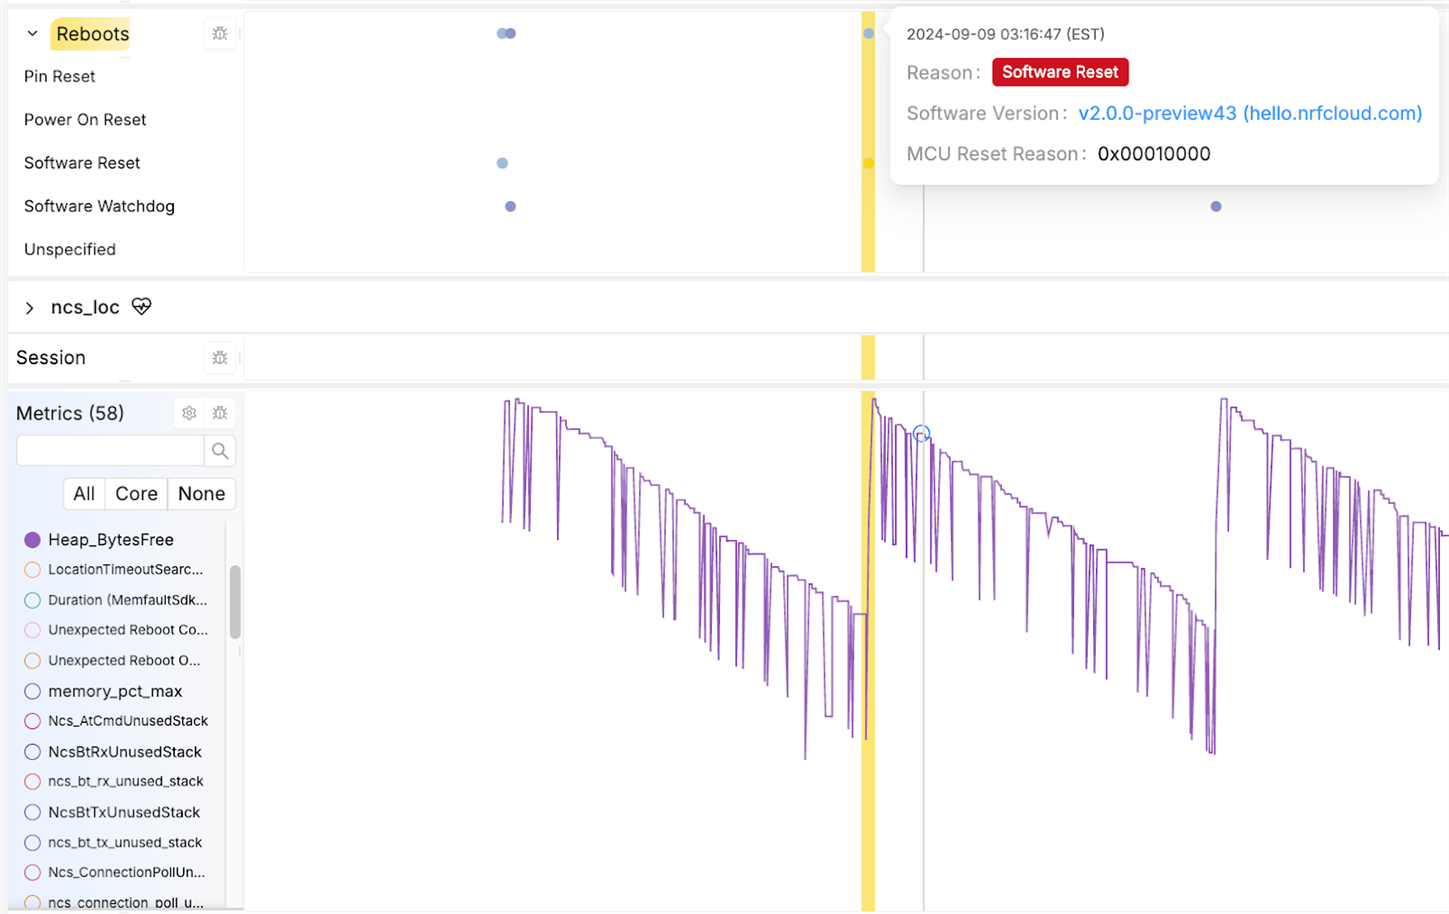
Memfault view of heap available decreasing over time, indicating a memory leak
Now that we realized there was a memory leak, we needed to narrow down which allocations were made but not freed before the system reset. Fortunately, we had heap allocation tracking via Memfault so we could see what memory had been allocated and freed when a crash occurred. In particular, we found a function in the Wi-Fi driver that failed to free memory allocated during location searches:
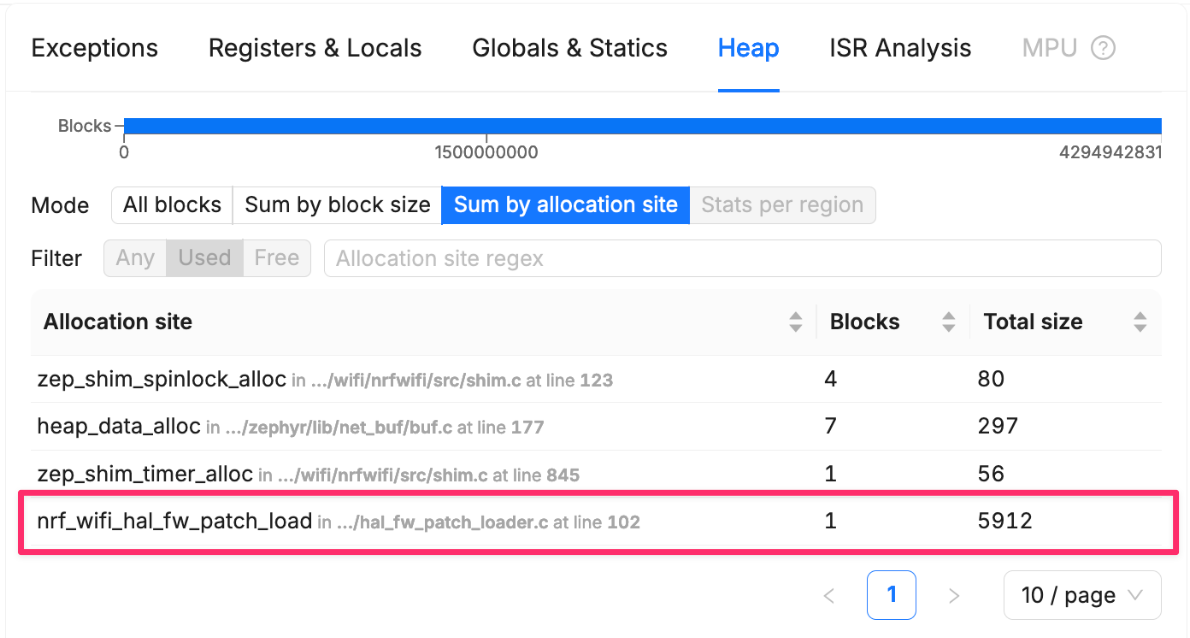
Memfault view of heap analysis indicating a large allocation of unfreed memory
Once we identified the root cause, we patched the bug and merged the fix, which you can take a look at in GitHub PR #325.
The debugging journey never ends at the fix though; we needed to be sure that this reliably solved the issue. Looking at an individual device, the evidence was clear:
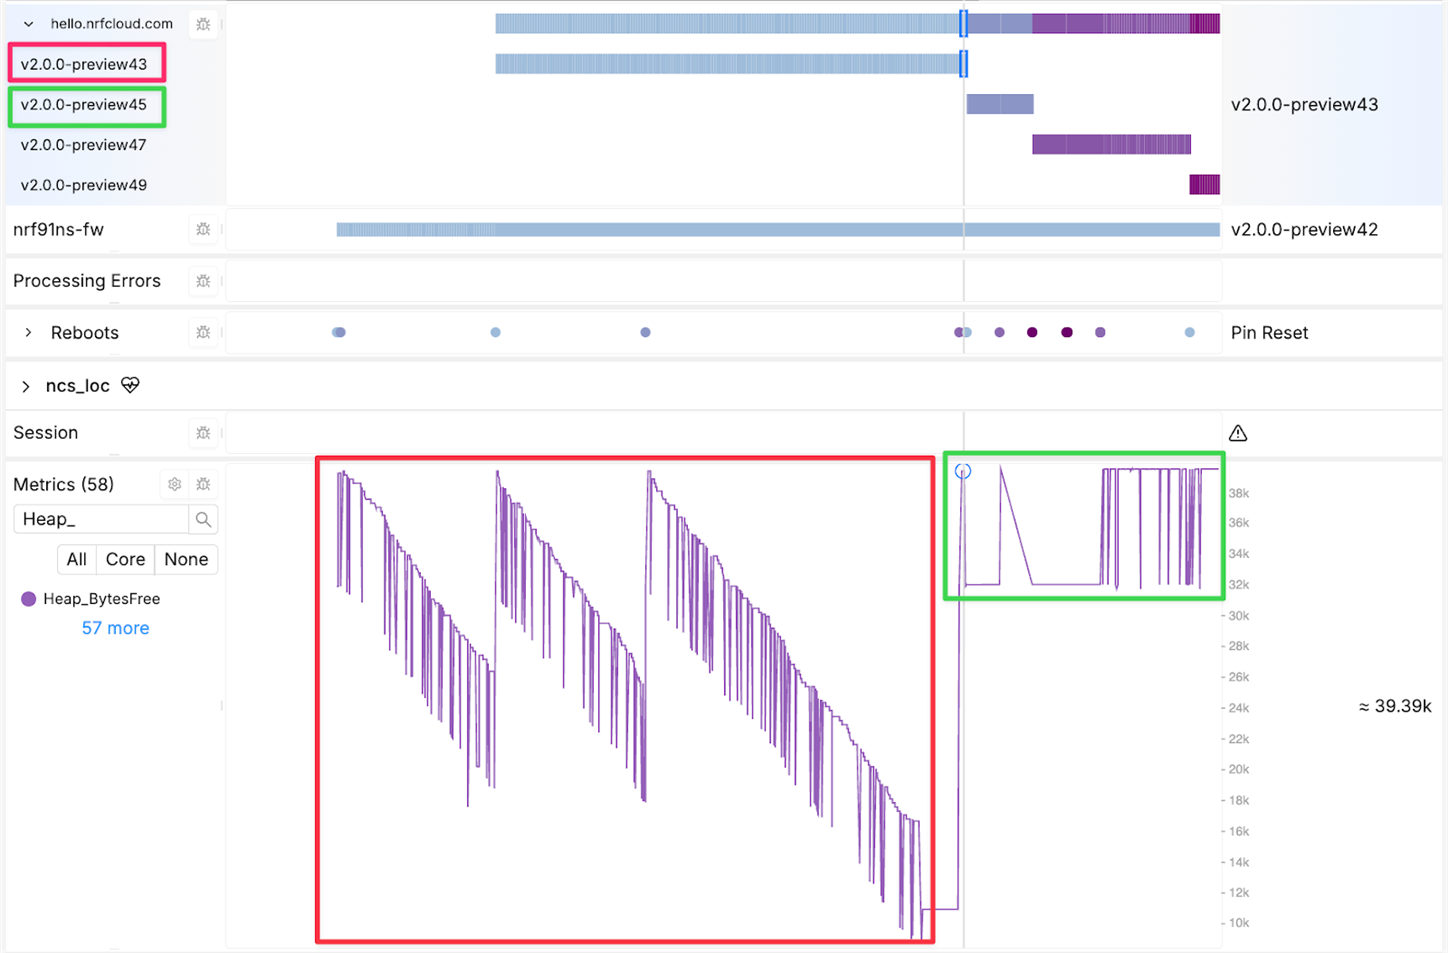
Memfault view of available heap stabilizing after a release with the bug fix
Aggregating the Heap_BytesFree metric and comparing it v2.0.0-preview43 and v2.0.0-preview45, we can clearly see the improvement across six devices and 393 samples after the fix was shipped to our field units:
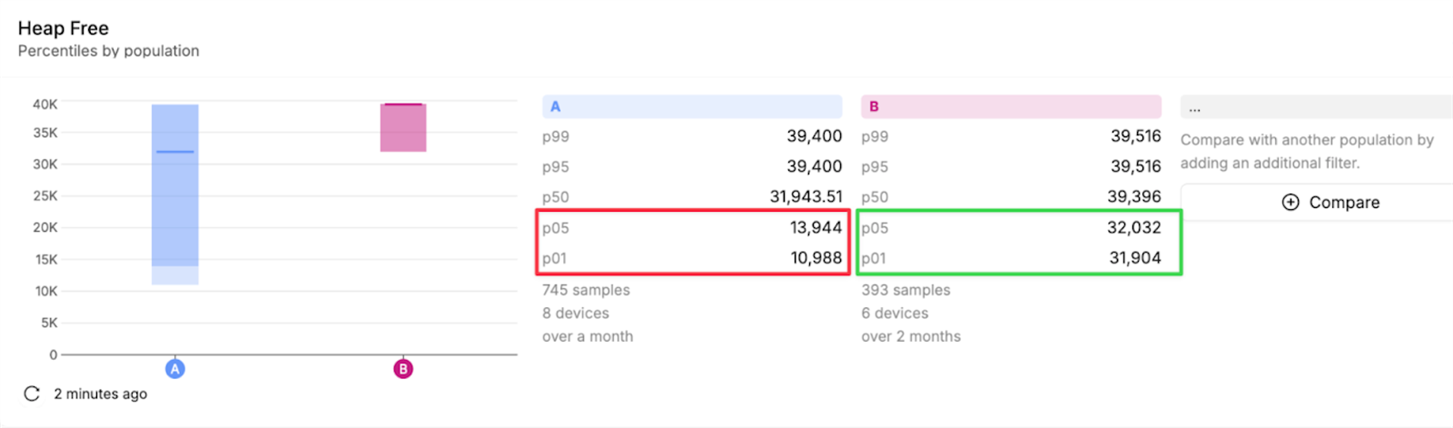
Memfault view of aggregate available heap improving across the fleet in the new release
Without Memfault, this process would have taken much longer, requiring tedious log collection and local reproduction.
Testing in the field: Poor RF conditions
Field testing is critical for our team to understand how devices behave in real-world conditions. One common pain point is debugging connectivity problems in areas with poor RF conditions. Before using Memfault, our only option was to stream modem traces over UART to a connected computer —this works fine for bench testing but is completely impractical for field tests in a parking garage or other low-signal environments.
Now, with Memfault, we can collect both core dumps and modem traces from field-deployed devices. This has been important for issues that occur when experiencing poor connectivity. In one case, we used modem IP-level trace capture via CONFIG_NRF_MODEM_LIB_TRACE_LEVEL_IP_ONLY to debug a tricky DTLS issue. We let the device run over a weekend in a weak signal area, recorded the modem trace via Memfault, and then downloaded it when we came back to work Monday. Custom data recordings (CDRs) are a feature in Memfault that enable more in-depth tracing that we wouldn’t usually have on by default, but are key to debugging when we need to investigate further. Like all data sent to Memfault, it appears in the device timeline and can be downloaded directly from there:
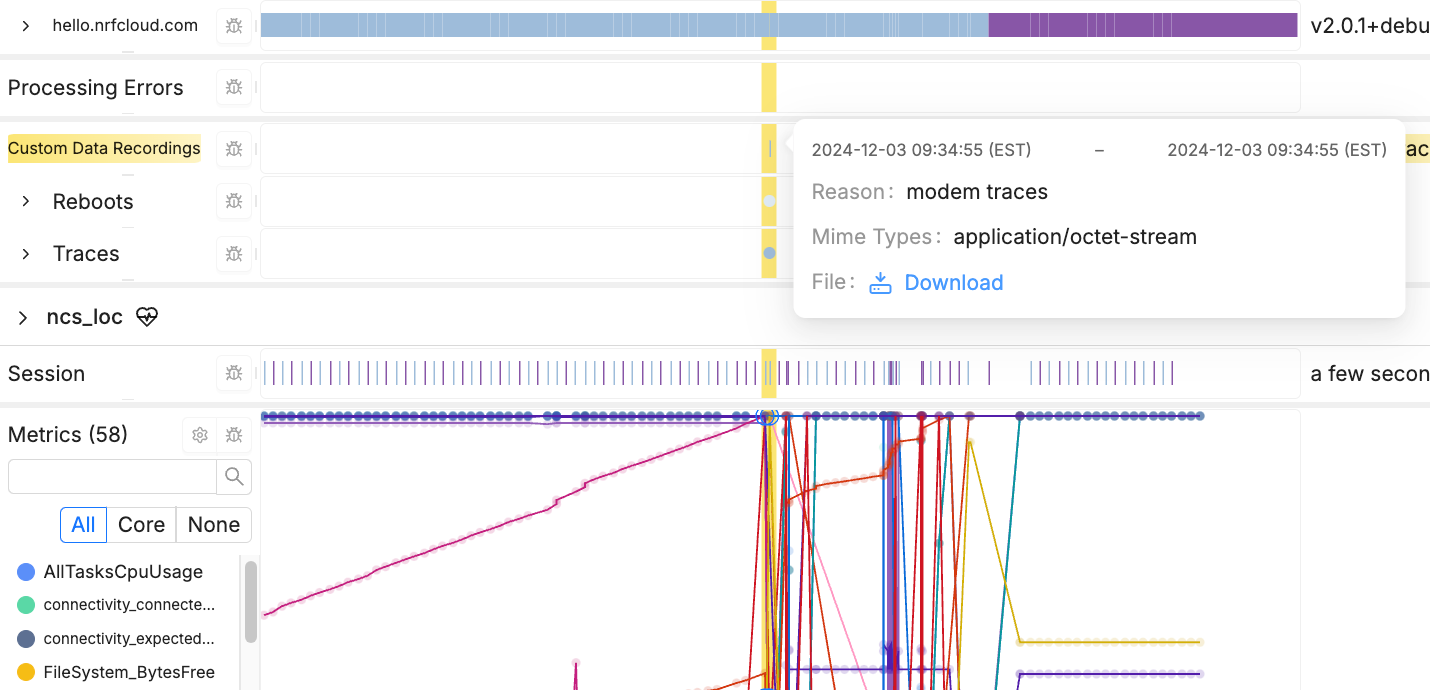
Memfault view of a modem trace as a custom data recording
In this trace, we wanted to decrypt the DTLS buffers to pinpoint whether the problem was on the device side or with the server—an important distinction when deciding where to focus our debugging efforts. In this case, we found a new bug in the firmware that shows up only in poor RF environments.
Modem traces have also helped us work with customers to identify cases where networks are not meeting 3GPP specifications. The list goes on for how important modem traces are to our team for issue diagnosis!
Detecting modem crashes
Modem crashes are another tricky problem. If the modem resets and a device then loses connectivity, figuring out what happened can be tough. To detect modem crashes, we started by searching for "crash" in a problematic device’s logs sent to Memfault:
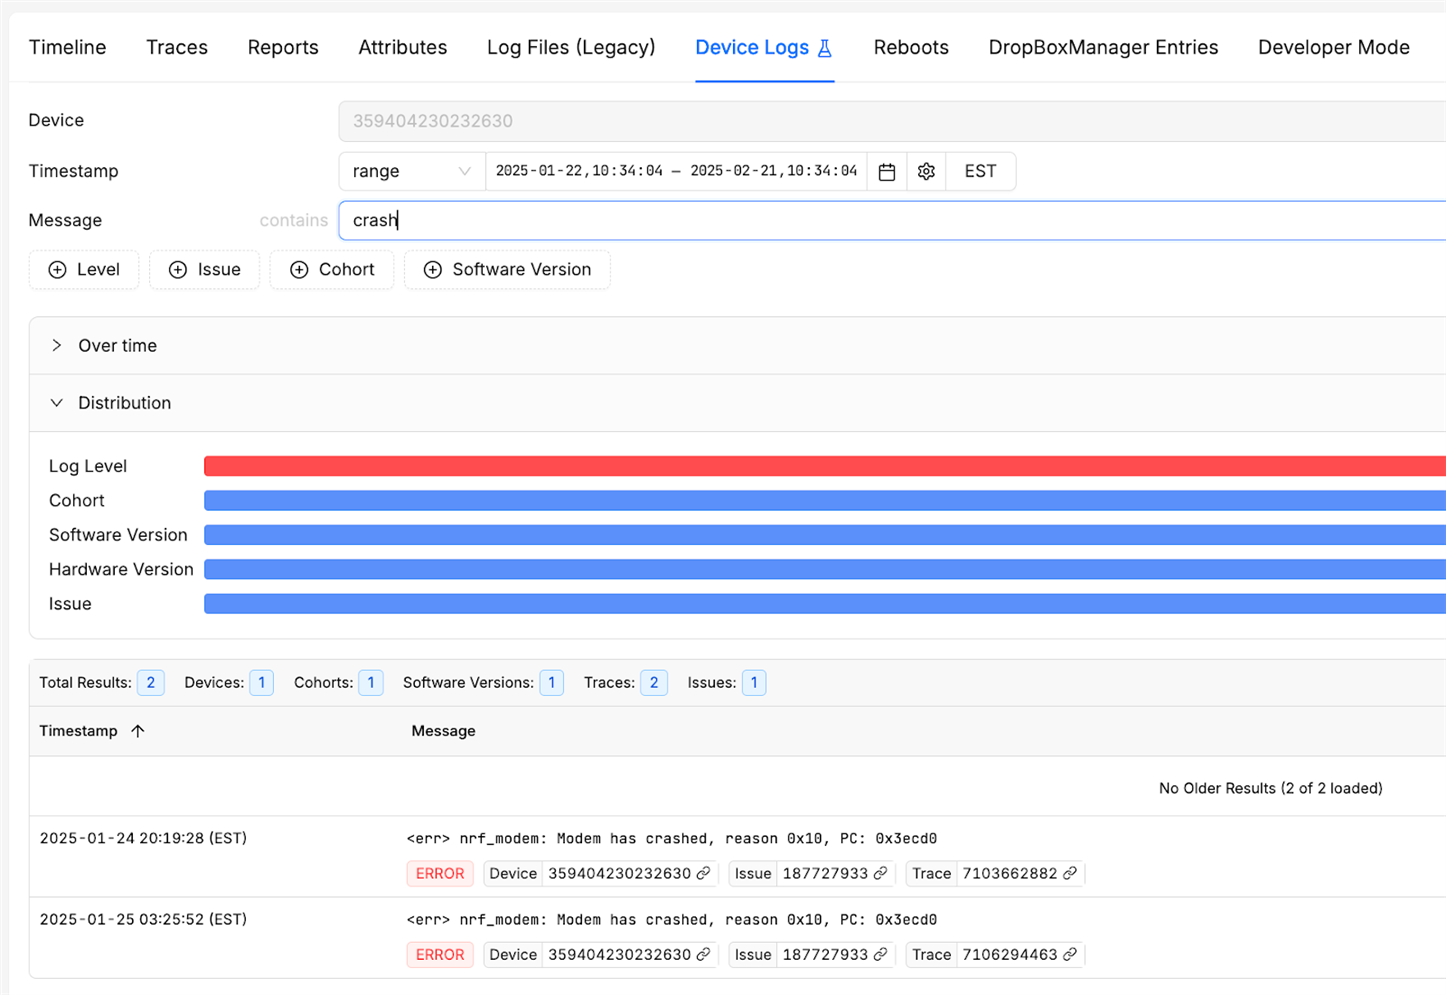
Memfault view of searching for modem crashes in a singular device’s logs
That led us to a key log entry showing a modem failure. From there, we expanded our search across the entire fleet, confirming that this wasn’t an isolated incident—multiple devices were experiencing the same issue:
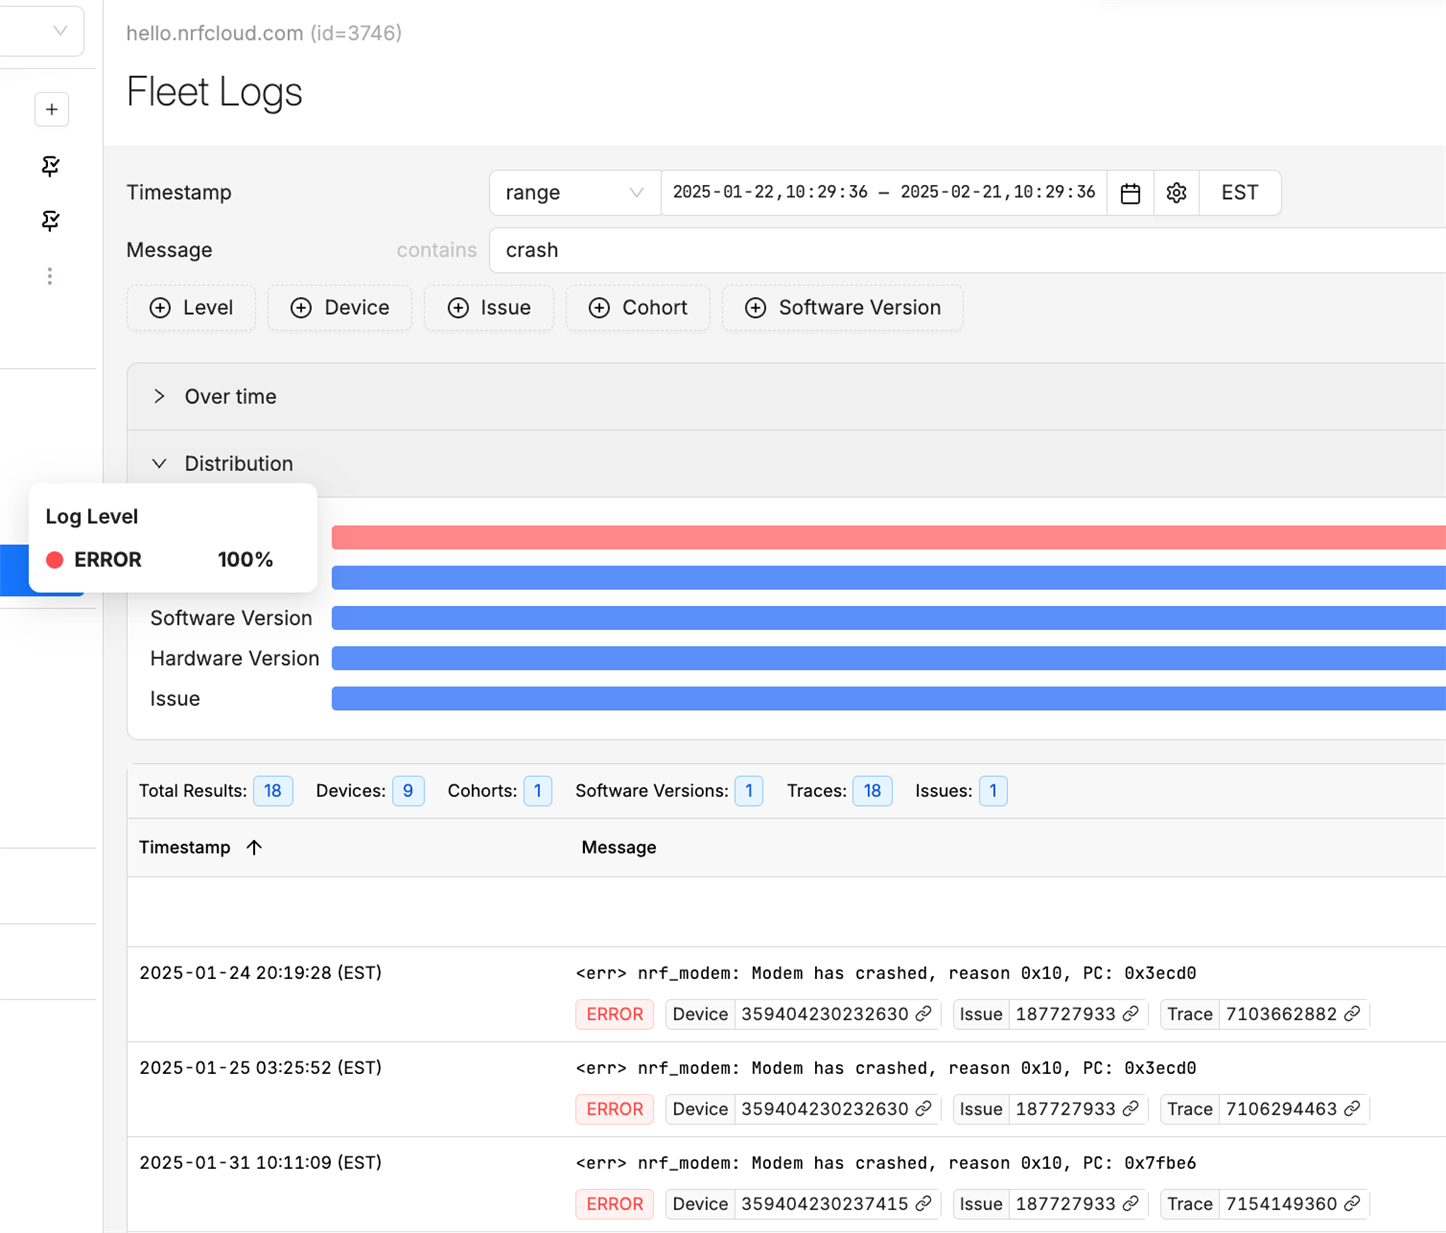
Memfault view of searching for modem crashes in fleet-wide logs
To get more insight, we captured a modem coredump, which is possible with all modem trace levels. These traces are stored in external flash, so in this case, increased tracing did not affect the firmware size. After collecting and analyzing the traces, we escalated the issue to our modem team, who could now see exactly what went wrong.
An important tradeoff with modem traces is data upload costs. Sending large traces over LTE isn’t cheap, so we are selective about only turning tracing on for a field device when we need it. To make this more scalable, we’ve integrated automated CI workflows that proactively upload modem traces for analysis, helping us catch issues earlier in the development cycle.
Closing
Debugging fielded systems leading up to a launch is hard, but Memfault has made it significantly easier for our firmware teams at Nordic. Whether it’s tracking down memory leaks, investigating modem crashes, or diagnosing connectivity issues in the field, the ability to collect structured telemetry, automate trace collection, and analyze fleet-wide trends has been a game-changer. Even though we find ourselves digging into extremely complex and nuanced problems, the return on our time investment has had a huge impact on a successful product launch. We are very glad to have used best-in-class observability tools before the Thingy:91 X hit the market!
If you’re working with Nordic’s Thingy:91 X or the nRF91 Series in general, integrating Memfault into your workflow could save you a ton of time and effort. Have you run into similar debugging challenges? Let us know in the comments—we’d love to hear how you tackle them!
Enjoyed this? Subscribe to DevZone blog email notifications and be the first to know about new posts!