



Debugging applications is a key part of every development workflow. Having good tools is very important to ensure problems and design errors are identified and diagnosed correctly, root causes are well understood and fixes are effective and validated.
Nordic users are probably familiar with the alternatives available in the nRF Connect SDK, which include multi thread and multi core systems. Let’s see how can we debug applications that use the RISC-V coprocessor.
Table of Contents
Method #1 - Pretending it’s not RISC-V
Let’s begin with the simplest way to debug the code your application will be running in the FLPR. It’s very likely your project will consist of a multi image build. Nothing prevents you to add a new build configuration, in the standalone project directory that contains the FLPR source code, and build if for the application CPU target. Then you can debug and test the code that will run in the FLPR with the same tools you are familiar with.
What will it look like? In this demo project, for example, armflpr_sample is the project that contains both the application CPU and the FLPR images (using the sysbuild.cmake file inside the project). armonly_sample is the code that runs in the FLPR, it’s in a different directory. It’s not a big deal to add a specific build configuration for the same DK, but using the cpuapp target. This will be completely independent of the first project too.

Although simple and quick, this method has some drawbacks though:
-
Even thought it might be the same C source code, the compilation process will naturally produce different binaries, as it will be built for a different architecture. This might cause some impact in the final binary size, and the execution time, and obviously will not work at all in the case your source code has portions written in assembly. However, it should still be ok for debugging high level logic and system workflows.
-
This approach will work better if the code running in the FLPR is either standalone, or does not have a lot of dependencies in events of the application CPU. Mainly because in this build the application CPU code will not run at all. On the other hand, it is also possible to mock those events and replicate specific scenarios that might be rare or hard to reproduce in the final system running both images.
Someone with spare time and “looping the loop” creativity may be thinking what about creating a third project to build an image to run the mock code of the application processor in the FLPR, while debugging the original FLPR code in the application CPU. Although technically possible, sounds a bit complicated, and it probably is a lot more too.
So let’s try to keep things simple, and evaluate other alternatives
Method #2 - Using multiple consoles
Logging to a console is one of the most common ways to diagnose problems in Embedded Systems. There might be some debate about whether it can be called “debugging”, as it does not involve a debugger at all, and does not allow individual inspection of variables or memory regions.
However it is a powerful option as it is possible to define two separate serial ports, one for the application CPU, and another for the FLPR. The logger module can have different verbosity for different submodules, and print a timestamp to diagnose timing problems for example.
The approach of using two consoles has the main drawback of requiring more physical connections to your board, as two different UARTs must be accessed by the host system. And of course, the UARTs must be available and configured correctly in the full design.
Just like we saw in the Memory Layout blogpost, the UART used in the FLPR core must be reserved in the DTS of the application CPU, and similarly the UART used by the application CPU must be reserved in the FLPR.
The DTS overlay will have something like this for example:
&uart30 {
    status = "reserved";
};
You can find more information about this in the Memory Layout blog post and in the nRF Connect SDK Intermediate course of the Nordic Developer Academy.
This method has one major advantage: it enables development of the full integrated system. Even though the logging might have side effects in the execution timing, it’s minimal, and probably as close as possible to the real life scenario.
Another important advantage is that this method can be used if your project build is optimized for size or speed, as these builds do not have any symbol information.
Method #3 - Attaching to running a target
Finally, is it possible to debug code running in the FLPR code, in a full system with the application CPU running as well? The answer is YES, and the way to do it is by attaching to a running target.
In this scenario you will build your application and flash it in your target like you would do it in a non debugging situation. Then, once it’s running, click in the three dots next to “Debug”, and select “Attach Debugger to Target”.
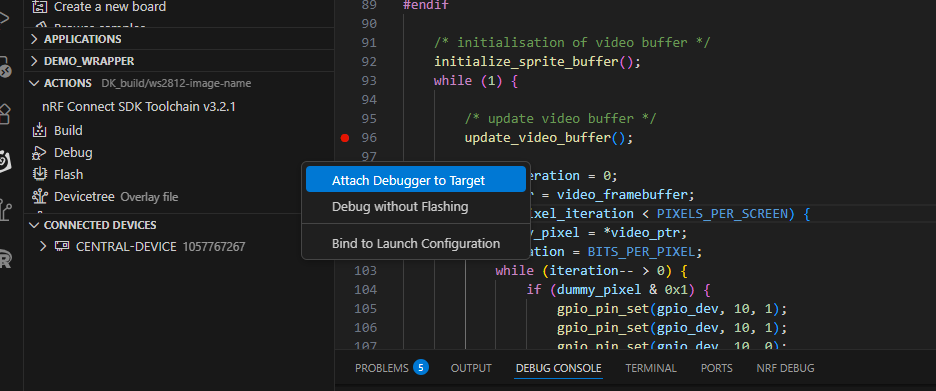
When you do this with the main build selected, you will get an extra prompt, asking what domain you want to debug. You should see in the list one for your application CPU, and one for the FLPR. You must select this last one.
For debugging you will need the build symbol information. The best way to ensure these are present is by setting the corresponding Kconfig option in both prj.conf files, by adding this line to them:
CONFIG_DEBUG_OPTIMIZATIONS=y
As the debugger will attach to a running FLPR, it will start in a running state. If you pause the execution, is very likely if you will find it in a wfi instruction, waiting for an interruption.
From there, you can navigate through your files, put a couple of breakpoints, resume execution, and that’s it, let the debugging begin!
It’s important to highlight that you cannot have a debug session running in both the application CPU and the FLPR at the same time - so the code in your application CPU should deal with the fact you will be halting the execution of the code in the FLPR, and not be impacted by that scenario.
Closing
In this post, we discussed a few alternatives customers can try when they need to debug the code of the RISC-V coprocessor in the nRF54L Series. Bugs in software are almost inevitable, so it is important to have good tools to diagnose and fix them.
