

#Why use trace
"Embedded Trace Macrocell (ETM) allows to capture information on the processor’s state without affecting the processor’s performance. Microcontrollers that include an ETM allow detailed program execution to be recorded and saved in real time. This information can be used to analyze program flow and execution time, perform profiling and locate software bugs that are otherwise very hard to locate. A typical situation in which code trace is extremely valuable, is to find out how and why a "program crash" occurred in case of a runaway program count." J-Link/J-Trace User Guide.
#Overview
Debugging features can be classified into two groups.
- Invasive debugging (i.e. program halt and stepping, HW breakpoints, etc...)
- Noninvasive debugging (i.e. memory access, trace, profiling)
Tracing is a form of Noninvasive debugging, and on nRF52 series devices there are three types of trace sources:
- Instruction trace: Generated by the Embedded Trace Macrocell (ETM).
- Data trace: Generated by the Data Watchpoint and Trace (DWT) unit.
- Debug message: Generated by ITM, provides message output such as printf in the debugger GUI.
The trace information is connected to the Trace Port Interface Unit (TPIU) and exported to external trace hardware (i.e. SEGGER's j-Trace external debugger).
IMPORTANT: To use trace you need to have an external debugger that supports trace (trace won't work using the on-board debugger on our development kits). https://www.segger.com/jlink-debug-probes.html (see debug probes with built-in trace memory). IAR and ULink also offer debuggers that support trace and work with our devices.
#Embedded Trace Macrocell (ETM)
http://www.arm.com/products/system-ip/debug-trace/trace-macrocells-etm/.
ETM allows you to observe how your software executes on the target device. ETM will be useful when debugging and optimizing your embedded system. When using conventional debug techniques there are some disadvantages: intrusive (behavior of the system is changed), non real-time, and no performance visibility. With trace, instruction and/or data transfer is collected and delivered off-chip in real-time (or stored on-chip for post processing).
Main benefits of ETM:
- Trace and debug your system executing in real-time.
- Collect vital timing on program execution for performance optimizations and ‘always-in-time’ code verification.
- Capture program activity around the event you want to look at.
#Setting up and using ETM
http://infocenter.nordicsemi.com/topic/com.nordic.infocenter.nrf52832.ps.v1.1/dif.html#debugandtrace
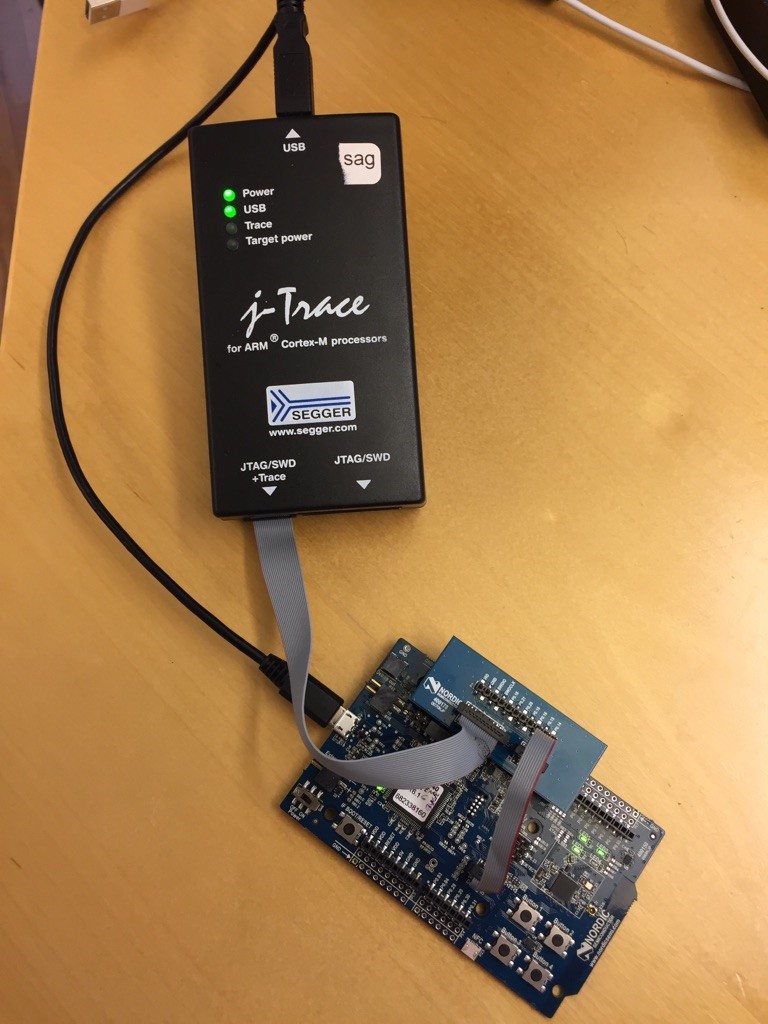
- Connect debugger (with trace functionality) to target device, making sure trace pins are connected (see which GPIOs are trace pins here: https://infocenter.nordicsemi.com/topic/com.nordic.infocenter.nrf52832.ps.v1.1/pin.html#pin_assign). Note that we have a custom board to make this easy but you will have to figure something else out.
The connector board schematic.
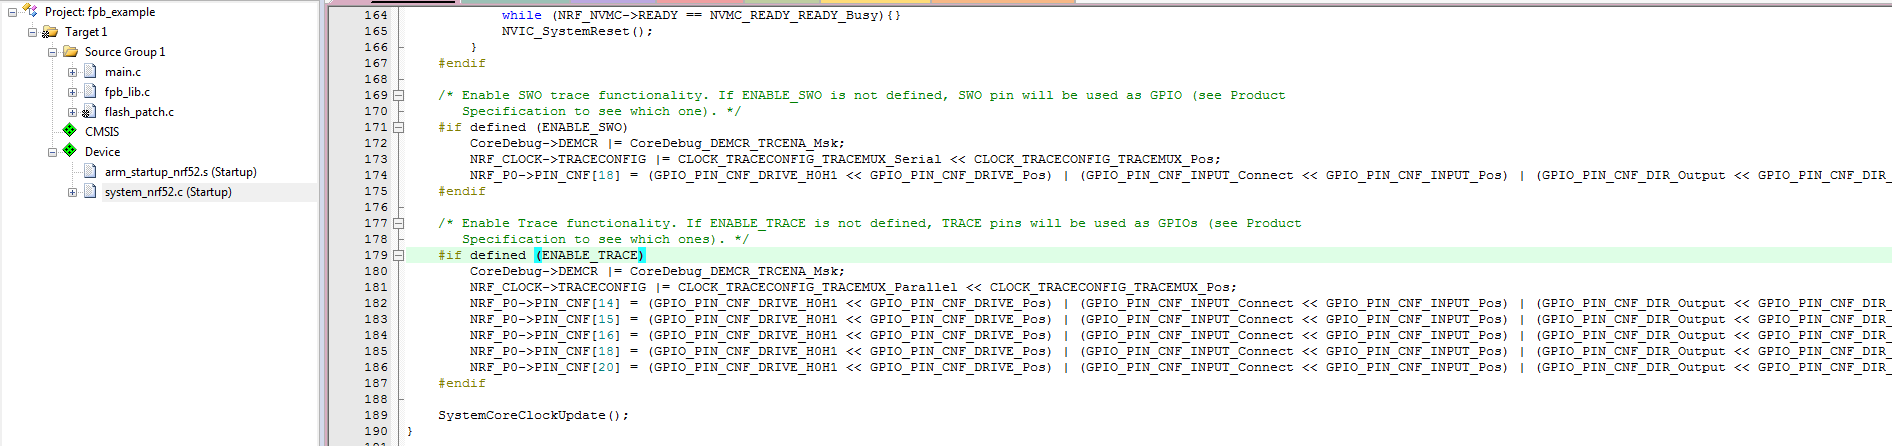
- Make sure you have up-to-date startup files and define ENABLE_TRACE in your project's preprocessor definitions. When this is defined trace functionality will be enabled in system_nrf52.c as seen in the screen shot below.
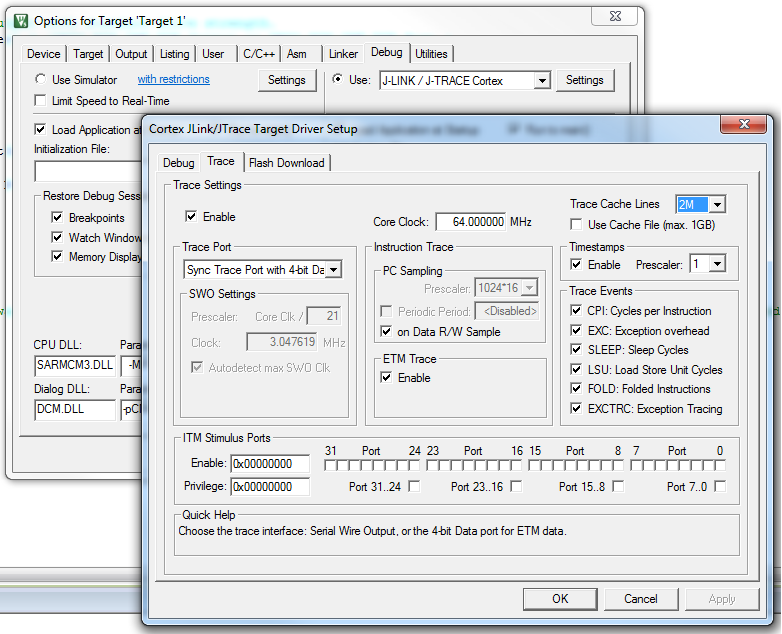
- Configure ETM in your Debug Settings as in the screen shot below. More info here: http://www.keil.com/support/man/docs/jlink/jlink_tracing.htm.
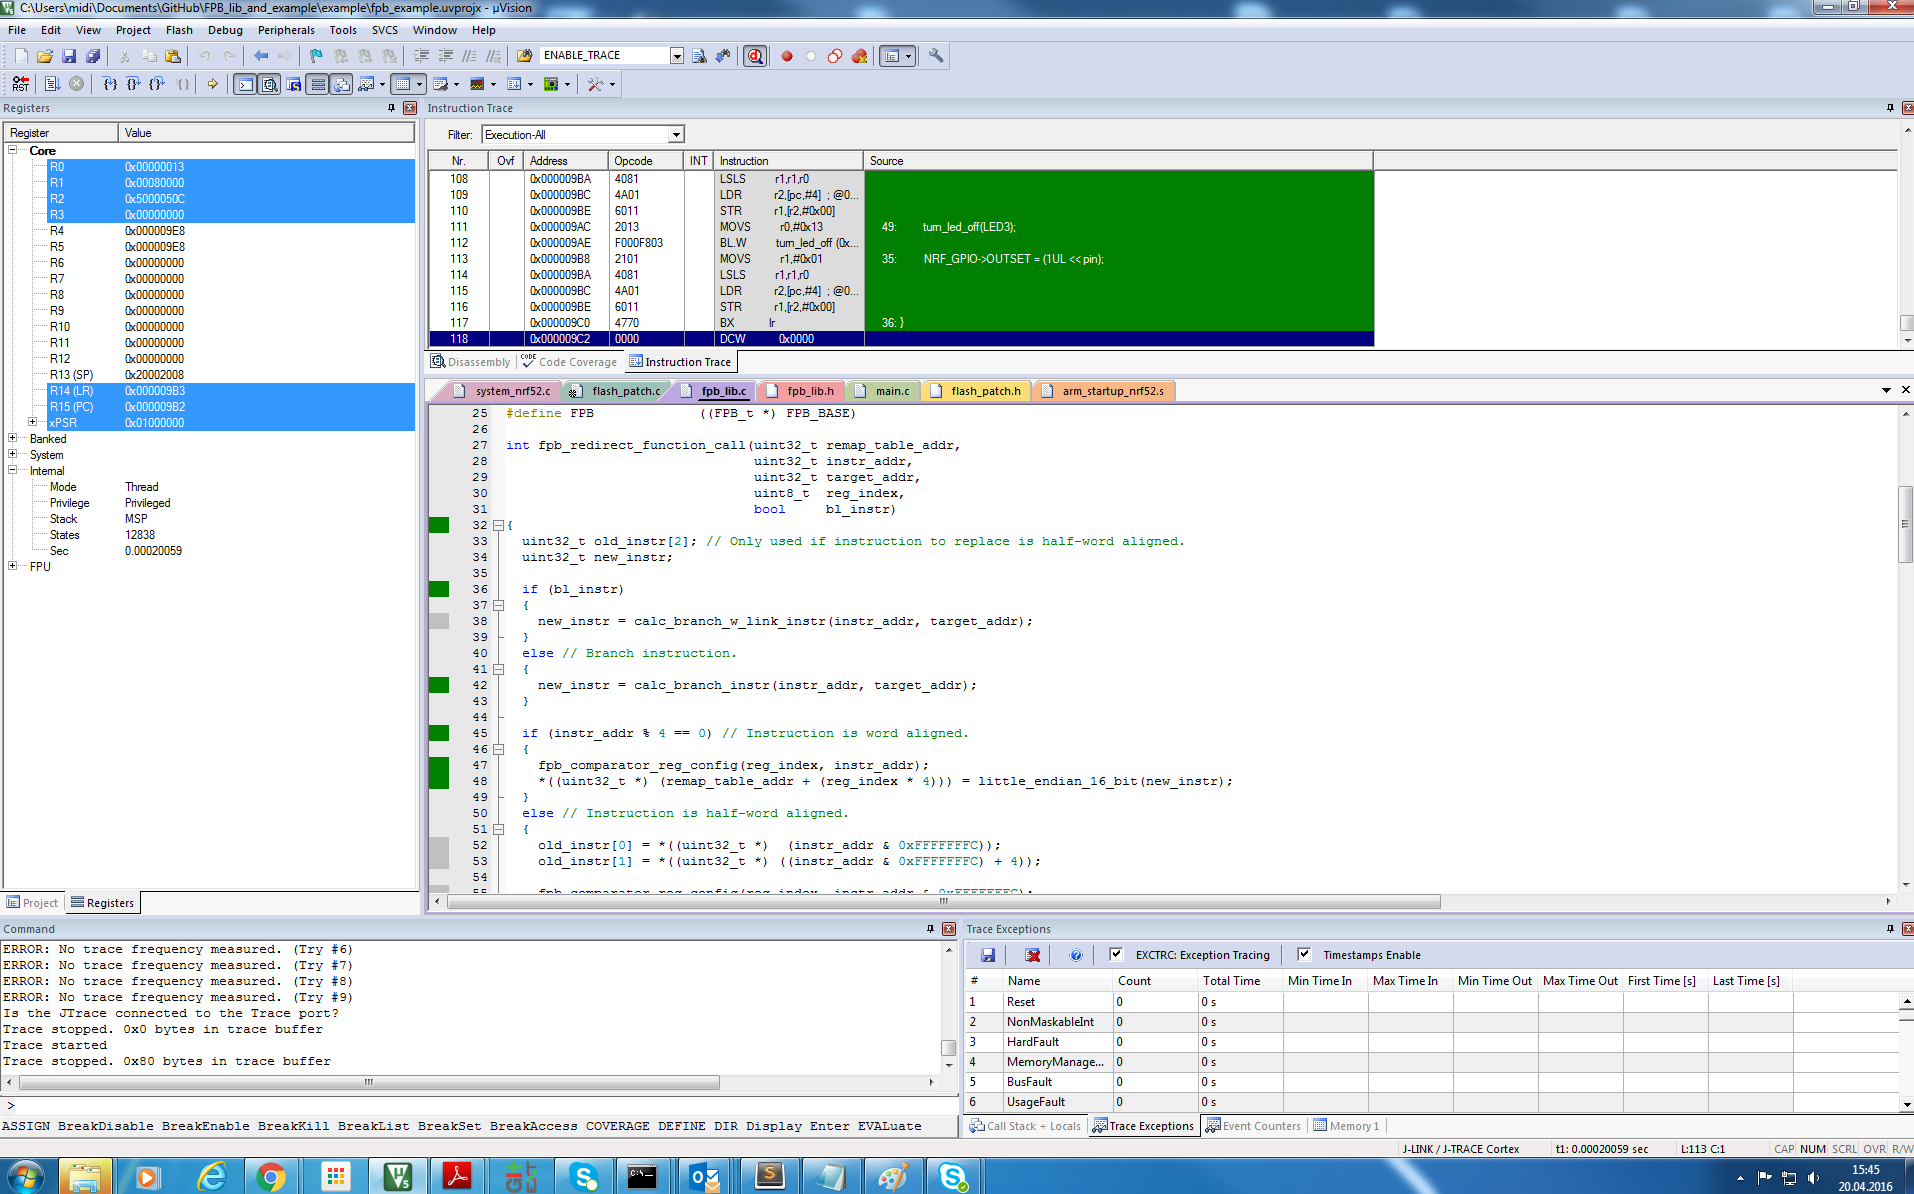
- Start the debugging session and open the Instruction Trace Window or the trace window of your choice. http://www.keil.com/support/man/docs/jlink/jLink_uvision_windows.htm.
From here just play around, see what trace is all about, and post what you find/any questions/concerns you may have in the comments!
#Conclusion I'm no expert here, so please share your experiences with trace. How has it been useful? What else could be said about trace? Feel free to offer suggestions about how I can improve this post either in the comments or a PM.
Top Comments