


The development of cellular IoT often requires insight into the network traffic and parameters provided by the network operator, information that isn’t always available through the application itself or easily captured by an external device. Nordic Semiconductor strives on providing tools to make the development process as smooth as possible, and being able to view the network traffic in real-time and effortlessly capture and view modem traces is of high importance for cellular IoT developers.
To ease the development process, we provide the nRF Connect for Desktop, a cross-platform tool framework for assisting development on nRF devices. It contains apps to test, monitor, measure, optimize and program your applications. This selection recently increased as a new application aimed for cellular IoT development appeared in the list: Cellular Monitor.
Our new Cellular Monitor app combines an extensive LTE dashboard, modem trace collection with real-time preview via Packet Event Viewer and, optionally, Wireshark logging for deeper analysis, and offers certificate manager as well. It combines the LTE Link Monitor and Trace Collector applications in addition to a lot of new features.
In this blog post, we will introduce you to the new features of the Cellular Monitor, by showing you how to capture a modem trace while running the Asset Tracker v2 application. We will start with updating both the application and modem firmware on the device through the Cellular Monitor application itself with one simple operation. Then, while capturing the trace, we will cover the dashboard view and Packet Event Viewer, and lastly show how to easily open the trace in Wireshark.
Table of Contents
Prerequisites
- nRF Connect SDK, preferably the latest version
- nRF Connect for Desktop
- Cellular Monitor app (available in nRF Connect for Desktop) v1.0.2 or higher
- nRF9160 DK or Thingy:91, running modem firmware version 1.3.1 or higher
Preparing the device
Before capturing the modem trace, we want to ensure our device is running the latest version of the modem firmware and the Asset Tracker v2 application. With the new features available, this can now be done directly in Cellular Monitor.
1. Install and launch the Cellular Monitor from the nRF Connect for Desktop.
2. (Optional) Enable the necessary Kconfigs in your application.
A window called “How to use Cellular Monitor” will show up, documenting the Kconfigs needed in your application to capture a modem trace:
CONFIG_NRF_MODEM_LIB_TRACE: enables the application to be able to receive the traces from the modemCONFIG_AT_HOST_LIBRARY: enables the AT Host library, which enables you to communicate directly with the modem using AT commands. This is necessary for some of the functionality that the Cellular Monitor has, which we will dive into in this blog post.
Since we will be programming our device directly from Cellular Monitor, these Kconfigs have already been enabled. If you are running your own application, go ahead and add these Kconfig to the prj.conf file and then build and flash the application to your device.
Select Close to proceed.
3. Make sure your device is connected to your computer via a micro-USB cable and turned ON. In the upper left-hand corner, go to Select Device and select your device (nRF9160 DK or Thingy:91).
4. Program the application and modem firmware.
4.1 In the left sidebar, scroll down to Advanced Options, and click on the button called Program device.
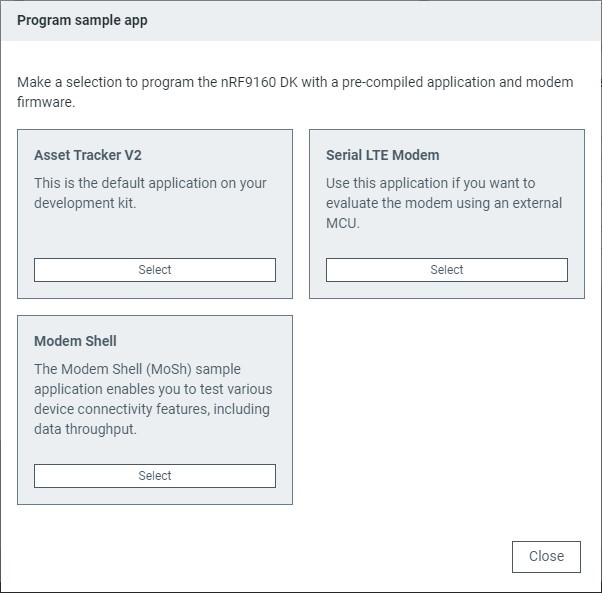 A window will show up, giving you the option between three ready-made samples to flash to your device, all available in nRF Connect SDK:
The three options are
With this feature, you can program your device with the latest modem firmware and one of the pre-compiled applications directly from Cellular Monitor.
4.2 Select Asset Tracker v2 by clicking the Select button in that window.
4.3 nRF9160 DK: In the next window, make sure that both “Modem” and Application” are selected, then hit Program. Wait for the process to be complete, which will be indicated by a green success message appearing at the bottom of the window.
4.3 Thingy:91:
4.3.1 Next, a window called “Program Modem Firmware (Optional)” will show up, asking if you want to program the modem firmware on the device before programming the application. Select the latest version of the modem firmware.
4.3.2 Enable MCUBoot mode on your device. To do this, turn off your device. Then press down the center black button (SW3) in the middle of the Thingy:91 while switching the power switch (SW1) to the ON position. Click on Program to program the selected modem firmware.
4.3.3 When the modem firmware is successfully programmed to the device, a green message will appear, and you can select Continue to proceed. This may take a few minutes.
4.3.4 Flashing the modem firmware takes the device out of MCUBoot mode, and you will once again need to put the device into MCUBoot mode to be able to flash the application firmware. Turn off your device. Then press down the center black button (SW3) in the middle of the Thingy:91 while switching the power switch (SW1) to the ON position. Click on the Program button to program the Asset Tracker V2 firmware to the device. When the application firmware is successfully programmed, a green message will appear.
Now that we have our device running the Asset Tracker v2 application and the newest modem firmware, we are ready to capture a modem trace using the Cellular Monitor.
Start the modem trace
1. Before we start capturing the trace, we want to configure the trace options found under Trace Options in the left panel.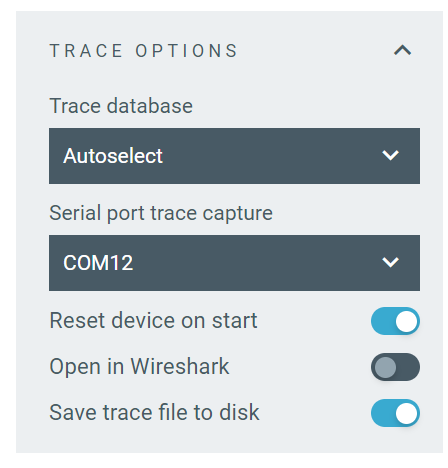
Trace database is used for decoding the raw modem trace. Each modem version has a separate one, so this needs to point to the modem firmware version running on the device. Select “Autoselect” and Cellular Monitor will automatically detect and select the version running on your device.
Serial port trace capture is the serial port that is outputting the trace information from the modem, also auto-selected by the application.
Make sure to select Reset device on start, which is useful for capturing the trace for the full application runtime. Open in Wireshark lets you look at the real-time trace details in Wireshark as its being captured. Lastly, Save trace file to disk ensures the trace is automatically saved locally on your computer, which we want enabled to be able to open it in Wireshark later.
2. Start capturing the modem trace.
Click on the Start button to start collecting the modem trace.
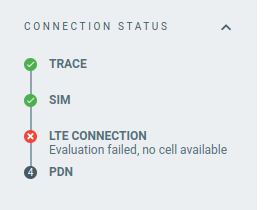 This will automatically light the first checkmark on the Connection Status view in the sidebar, titled “Trace.” After some time, the three other checkmarks should light green, meaning the operations were successful. If an operation fails, it should display a red X, along with a reason for the failure.
SIM is the status of the SIM card, for example, if you remove your SIM card from the device, then the SIM should turn red. PDN (Public data network) refers to the endpoint that you connect to and is turned green when the device has successfully connected to an endpoint.
3. Refresh the dashboard.
To display the most recent information on the dashboard, let's use the feature called Refresh dashboard, found in the left panel towards the top. This will send a series of AT commands to the modem to receive updated information back, which is then used to update the information in the dashboard and the Connection Status view.
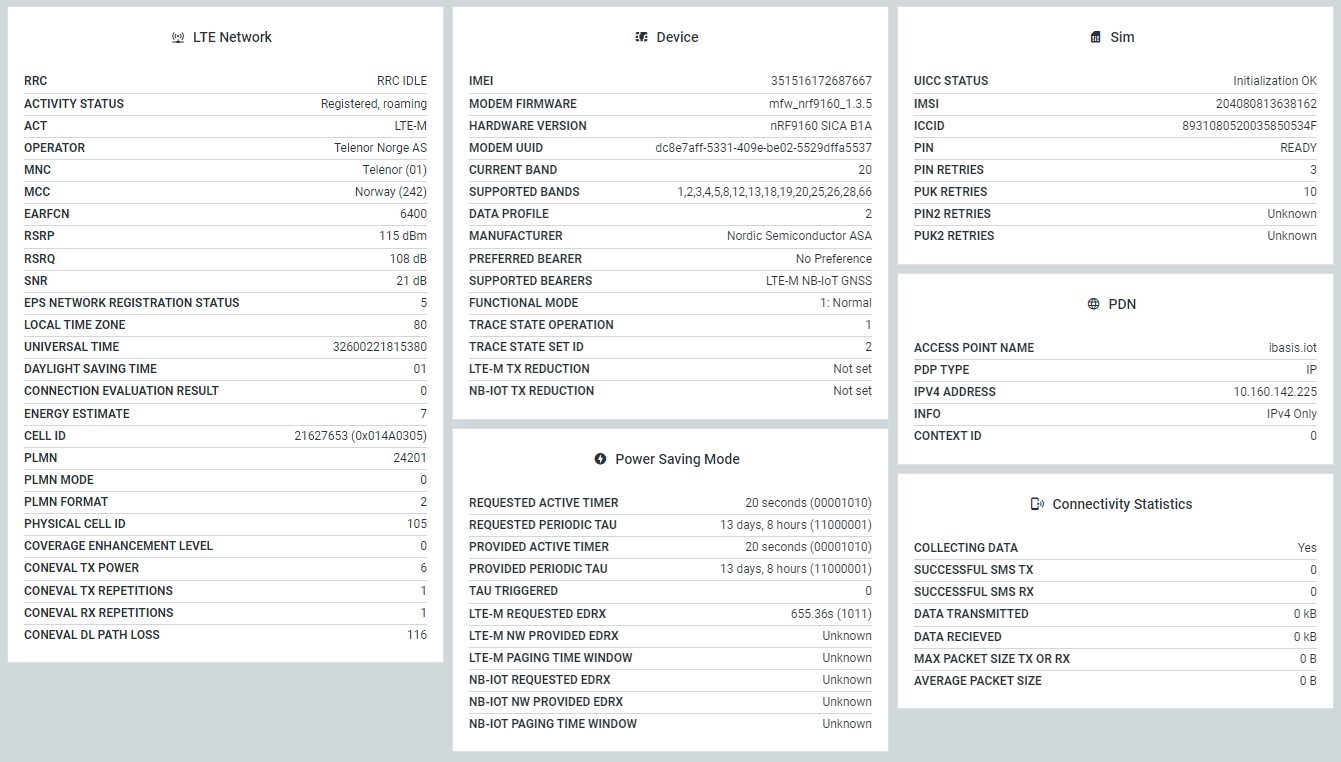
Dashboard
Let’s take a closer look at the information displayed in the dashboard. When you hover over any of the fields, you will get a small description of the field, including related AT commands with links to the documentation. And if you are actively capturing a trace, you will also get the option to run the relevant AT command from there and even the possibility to run them from there.
The dashboard contains six subpages:
- LTE Network: Information about the LTE connection, including eBN (cell tower) and operator information.
- Device: Device information, such as IMEI, modem and hardware version, and radio configurations.
- Power Saving Mode: Power saving mode configurations and parameters set by the network
- SIM: Status and information about the SIM.
- PDN: Information about the end-point to the internet, including IP address.
- Connectivity Statistics: Information such as the amount of data and packet size during the session.
Packet Event Viewer
Another new feature is the Packet Event Viewer, located right underneath the dashboard.
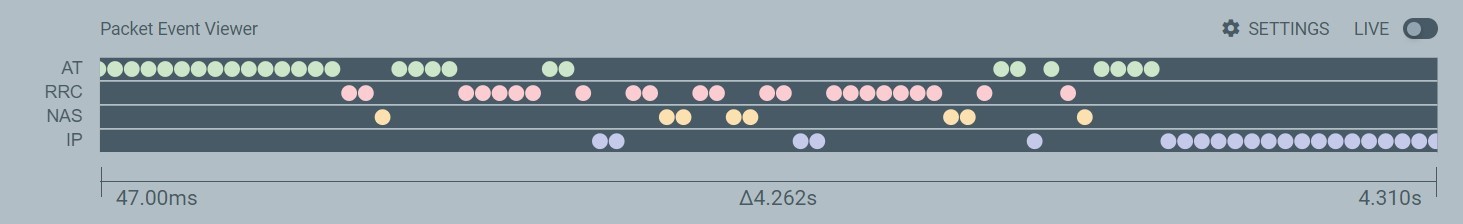
The Packet Event Viewer displays the incoming commands from the modem on the AT, RRC, NAS, and IP levels. Hovering over the AT commands (the circle in green) will show more information about the specific event. In the upper right-hand corner, there is the Settings Menu and an option to turn off Live mode, which will freeze the window in that time.
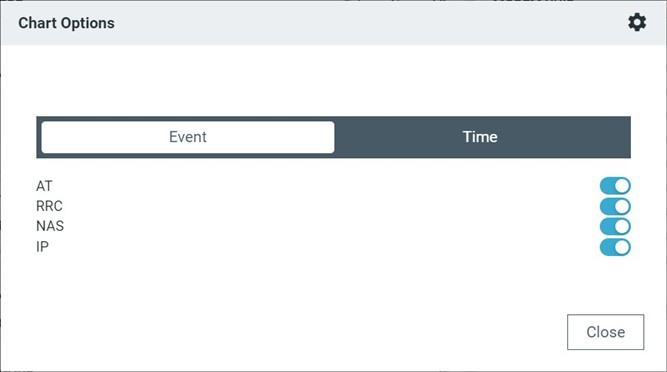 You can use your mouse to zoom in and out to change the scale and drag the graph to move the time slice shown. Notice that the default view places the events consecutively and at an equal distance apart for readability. To look at the actual time scale, go to the Packet Event Viewer settings (in the upper right-hand corner of the sub-window) and switch to Time. Here, you can also hide unwanted command layers.
Moving through the timeline on the Packet Event Viewer, notice that the information displayed in the dashboard will change. The dashboard will always reflect the information from the last packet that is shown on the timeline.
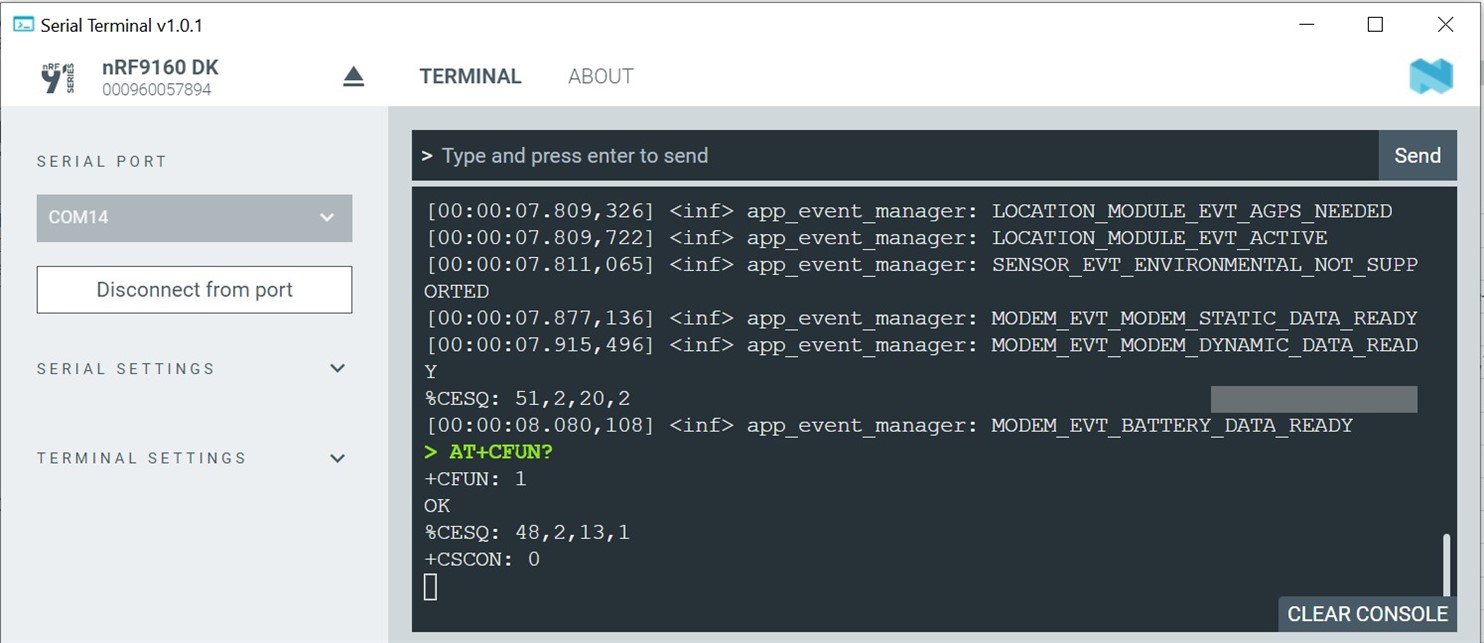
Serial Terminal
When capturing a modem trace, it is very useful to monitor the log output from the application simultaneously. Cellular Monitor has a shortcut to easily do this by selecting Open Serial Terminal, located underneath the Start button. This opens the Serial Terminal application (also available in nRF Connect for Desktop) and auto connects to a UART port on your device to automatically start displaying log output. Now we can see all the UART communication as well as sending commands (if the application supports it).
Viewing the trace in Wireshark
1. When the application has run for a few minutes, or you’ve encountered the error you want to debug, press the Stop button (previously the Start button) to stop the trace capture.
2. (Optional) If you’re not sure if you have Wireshark installed, enabling the “Open in Wireshark” option under Trace Options will prompt the app to check if you already have Wireshark installed, and if you don’t, it will provide the Wireshark install link.
3. To open the trace in Wireshark, we need to convert the RAW file we have captured into a PCAP file.
RAW files capture all traffic to and from the modem and are larger than PCAP files. Some of the traffic is proprietary to Nordic Semiconductor and not publicly available. A RAW file is generally to be used only when getting debugging assistance from Nordic Semiconductor.
3.1 In Cellular Monitor, disconnect from your device by selecting the eject icon to the right of your device name in the upper left-hand corner. The side panel will now show a different menu.
3.2 Under File Actions, click on Open trace file in Wireshark… and select the trace file we just captured. It will be the one most recently modified and with the most recent time stamp in its name. Then select Open. This will convert the trace into a PCAP file and open it in Wireshark.
To learn more about reading trace files, we recommend going through Lesson 7 – Debugging with a modem trace in the Cellular IoT Fundamentals course at the Nordic Developer Academy.
Other features
The Cellular Monitor also contains a Certificate Manager tab, known from LTE Link Monitor. This can be used to quickly provision certificates to your devices. It provides a user interface to easily paste in individual certificates, such as the CA certificate or pre-shared key, and either update or delete them. Alternatively, you can load the certificates from a JSON file, input the security tag and update all certificates with the press of a button.
Lastly, there is a feedback tab so users can provide feedback to improve future versions of the application.
Closing
We have now covered the features of the new Cellular Monitor application, which will drastically improve the user experience and reduce the learning curve of debugging cellular applications. If you have any feedback or feature requests, please include them in the Feedback tab in the tool itself.
For more information about our cellular IoT technology and product series, see the Cellular IoT Fundamentals course on the Nordic Developer Academy, a self-paced, hands-on online course focused on teaching the essentials of cellular IoT application development.
Want more content like this on DevZone? Please feel free to like this post and leave a comment below, letting us know about your experience with Cellular Monitor.
Top Comments
-
$core_v2_ui.GetResizedImageHtml($comment.User.AvatarUrl, 44, 44, "%{border='0px', alt=$comment.User.DisplayName, ResizeMethod='ZoomAndCrop'}")
$core_v2_ui.UserPresence($comment.User.Id)
$comment.User.DisplayName
-
Cancel
-
Vote Up
$currentVotes.ToString("+0;-0;0")
Vote Down
-
$core_v2_ui.Like($comment.CommentId, $comment.CommentContentTypeId, "%{ Format = $likeFormat, IncludeTip = 'true' }")
-
Sign in to reply
-
More
-
Cancel
Children