


Update: Jan-2024, with NCS v2.5.1
Reliability and latency are the key parameters to be optimized to achieve a seamless experience for the end users in the Bluetooth mesh based lighting control systems containing switches, sensors, and light fixtures.
In this blog post, we present the results of a test project that was conducted in a real-life environment in Nordic’s office in Trondheim. By learning the results of these tests, you will better understand the performance of the underlying Bluetooth mesh stack. You will also gain background knowledge to make technical choices and configure the network for a better user experience within the limits set by the Bluetooth Mesh Profile specification for your use case.
Table of Contents
Hardware and network setup
- Platform: nRF52840
- Number of nodes: 99
- Backbone for data collection: Ethernet
- Location of nodes: Ceiling plates
- Distribution: Roughly equally distributed throughout the floor.
The network uses internal power over an ethernet (POE) development board that has an nRF52840 chip, an ethernet chip, a POE circuitry for powering up the board, and a high-power LED for visual indication purposes (see Figure 1). Ethernet port allows the running of test procedures, allows the collection of logs simultaneously from all the nodes, and allows time synchronization using ethernet broadcast frames.
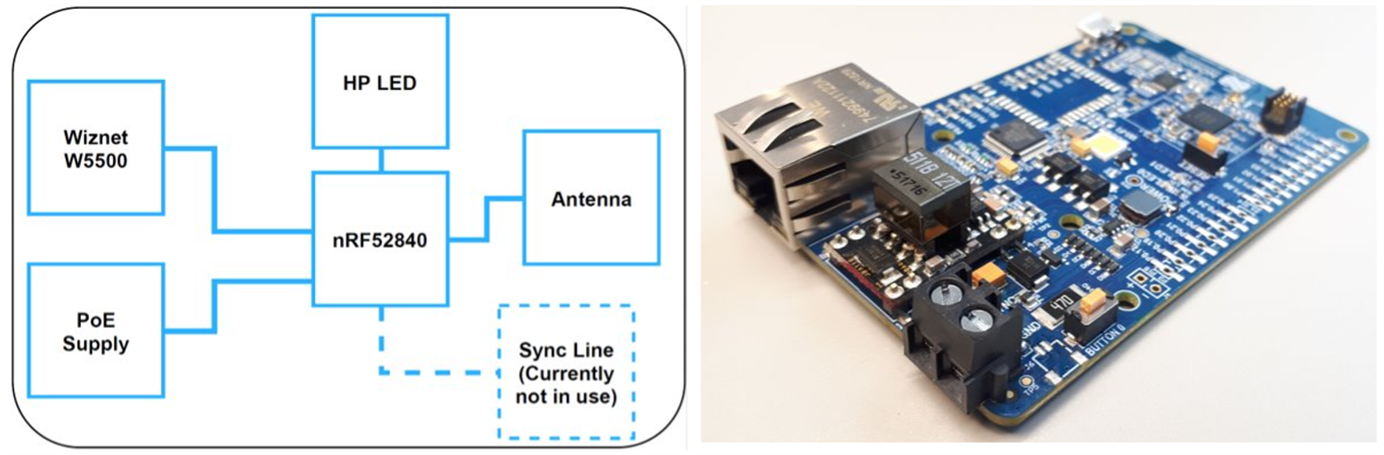
Figure 1: Block diagram and photograph of the board
The distribution of the boards on the floor gives a realistic situation where a considerable amount of interfering radio signals are present in an office environment. In this case, there are several interfering signals with the following traffic:
- Wi-Fi traffic
- Bluetooth Low Energy traffic from personal devices
- Other 2.4 GHz traffic (this includes Bluetooth Low Energy and other protocols) from the devices used on developer’s desks.
Update: During the Jan-2024, test run, there was minimal (almost none) interfering traffic for the network. So the results should be interpreted considering this change in the environment.
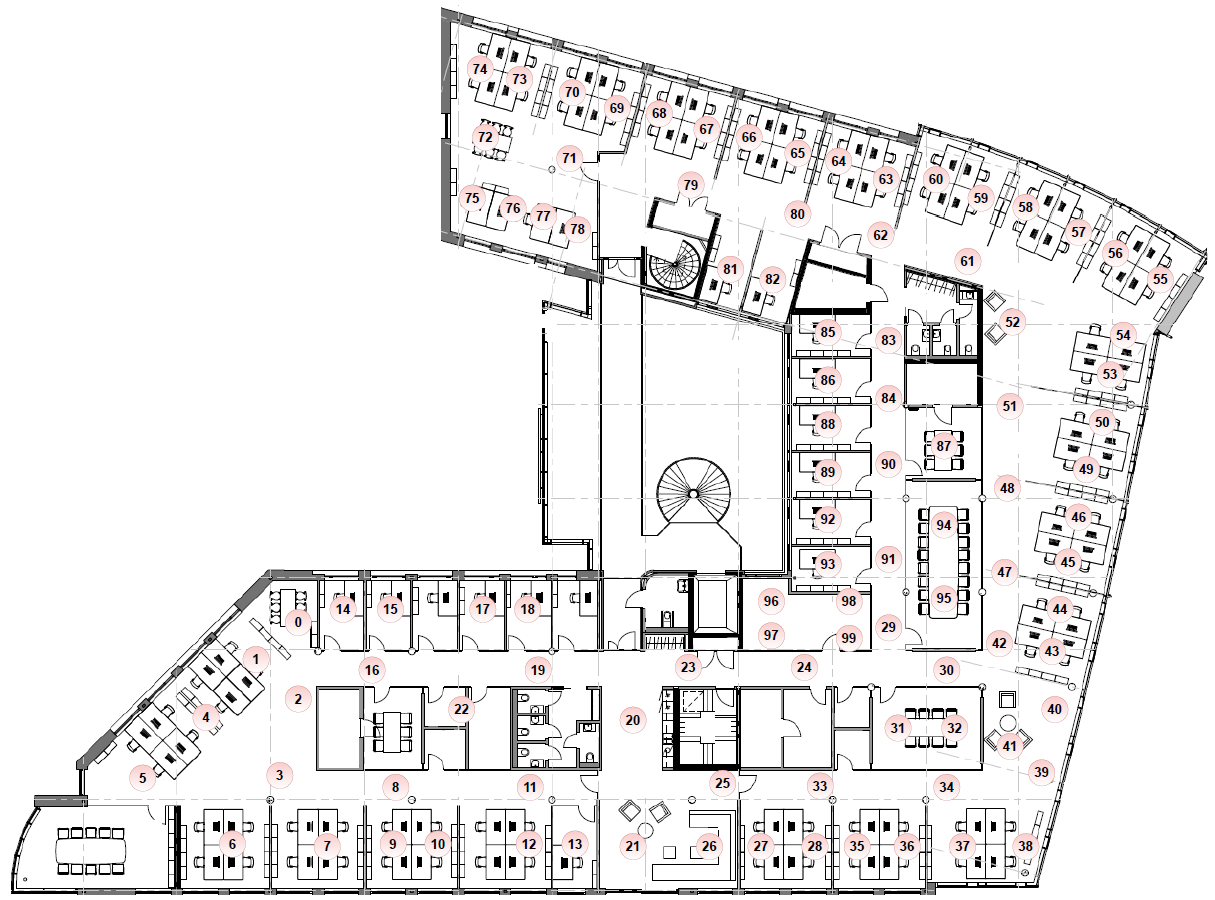
Figure 2: Placement of POE boards
Bluetooth mesh performance testing
The Bluetooth mesh protocol uses a flooding approach to increase the range of communication. Relay nodes forward the received mesh messages if they determine that these messages can be relayed further.
Applications that use Bluetooth mesh for communication desire to meet certain performance parameters such as message delivery latency and reliability. The performance of the network varies depending on the ambient operating conditions and underlying network stack parameters.
This post presents the latency and reliability performance of the network using unsegmented acknowledged and unacknowledged messages in a quiet network. The quiet network means that there is no other messaging activity except for mesh secure network beacon transmissions (as defined in the mesh specification), within the network. For this test, nRF Connect SDK v2.5.1 was used as the testing tools were dependent on this version of the SDK.
Stack configuration
All nodes run the same application except for default configurations for the presence of the relay feature, Network Transmit settings and Relay Retransmit settings.
Controller configuration
SoftDevice Controller is used.
Most Bluetooth mesh-related defaults are kept the same as used in sample applications. However, some of the Bluetooth mesh stack configuration parameters are updated to suit the network's size and allow communication between a large number of nodes. The relevant Bluetooth mesh parameters that are overridden are mentioned below:
CONFIG_BT_SETTINGS=n
Boards boot as pre-provisioned and don’t need persistence storage.
CONFIG_BT_MESH_MSG_CACHE_SIZE=256
A larger cache size is selected to allow better filtering of duplicate packets and prevent unnecessary relaying.
CONFIG_BT_MESH_CRPL=128
Since the tester node communicates with all nodes in the network CRPL value should be higher than the total number of nodes in the network.
CONFIG_BT_MESH_NETWORK_TRANSMIT_COUNT=<configurable as per test scenarios>
The Network Transmit Count value is selected as per the scenario under test. See Section 3.3.1.3 and Section 3.3.2.3.
CONFIG_BT_MESH_RELAY_RETRANSMIT_COUNT=< configurable as per test scenarios>
The Relay Retransmit Count value is selected as per the scenario under test. See Section 3.3.1.3 and Section 3.3.2.3.
Latency measurement
Latency is defined as the time it takes for a Bluetooth mesh message to travel from a source node to a destination node. The latency measurements can be of two types:
- Round-trip latency (RTL): It is the interval between sending a request message and receiving a response message.
- One-way latency (OWL): It is the interval between sending a request message and receiving this request message on the destination node.
Round-trip latency is usually important for node configuration messages such as messages used by the Config Server model. These messages always expect responses. A single gateway in a network installation can configure a whole network of mesh nodes. For such use cases, knowing round-trip latency performance is important as it can indicate how long it will take to configure or re-configure all nodes in the network. Therefore, measuring the latency performance of acknowledged messages shows how the overall network behaves and what performance to expect in a large network.
The Bluetooth mesh stack operates at a higher abstraction level and communicates with a Bluetooth controller through host API. The host communicates with a controller via the HCI interface. This causes some unpredictability in the timing of the advertisements from the point of view of the higher layers, such as mesh models, that provide a mesh message to be sent. Measuring round-trip latency also reveals the performance of the underlying network stack and how a large-scale network operates in the office environment.
Reliability measurement
Reliability of message delivery (here onwards referred to as only: reliability) measures how many messages are delivered to a destination node for a given number of messages sent by a source node. Measuring reliability is important for unacknowledged messages. Mesh lighting applications and devices typically use unacknowledged messages to turn luminaires ON/OFF or to control dimming.
Knowing the reliability of message delivery with various network parameters can help determine the optimal set of parameters for the guaranteed delivery of messages under various operating conditions.
Knowing the reliability of message delivery is generally unimportant for acknowledged messages. If the message is undelivered, the application will not receive a response message and can retry several times if needed. In this post, the data about reliability for acknowledged message delivery is presented with only a single sending attempt performed at a model layer.
Test methodology
With unacknowledged messages
The following methodology is used to carry out latency and reliability measurements using unacknowledged messages.
Initial conditions
- The network does not have any traffic other than mesh beacons. Non-mesh traffic in the office environment is expected to be present all the time and is unpredictable.
- Unacknowledged messages are not retransmitted at the model layer.
- The number of iterations (COUNT) for each node is set to 100.
Test procedure
- Initialize the network by flashing the test firmware on the nodes. The Firmware sets Network Transmit and Relay Retransmit setting values and configures the relay feature.
- Pick up one node in the network as a tester node. This node stays fixed as a tester node throughout the entire test.
- Pick up one node in the network as a target node.
- Configure publication settings of the tester node to send messages to the selected target node.
- Synchronize time on all the nodes for the purpose of latency measurements.
- Send unacknowledged message from tester node to target node, record timestamp on the tester. Wait for some time for mesh relays to settle and finish relaying all messages.
- Once the target node receives a message, record the timestamp on the target node.
- Repeat steps 5 to 7 until a set of 10 messages are sent(Or until the remaining number of messages are sent).
Note: Time sync achieved on the nodes starts going out of sync because of random variations in crystal PPMs. Therefore, the measurements are done in batches of 10 messages, and time is synchronized again.
- Collect timestamps from the tester and target nodes to compute one-way latency.
- Repeat steps 4 to 9 until the total number of sent messages equals COUNT.
- Pick the next node in the network as the target node and repeat steps 3 to 10. Repeat the step until all remaining nodes are covered.
Test constraints
The following table shows the test constraints used while executing the test procedure.
|
Constraint |
Specifics |
Additional information |
|
Access message type |
Unsegmented unacknowledged message |
- |
|
Unacknowledged retransmissions |
0 |
No retransmissions from the model layer. |
|
Addressing |
Unicast |
A tester node sends a message to a single unicast address on a destination node. |
|
Publish TTL |
7 |
Fixed value is used irrespective of the choice of target node. |
|
Publish retransmit |
0 |
- |
|
Network Transmit Count (NTC) |
<variable> from 0 to 2 |
Used as a variable for different scenarios. |
|
Network Transmit Interval |
20 ms |
- |
|
Relay Retransmit Count (RRC) |
<variable> from 0 to 2 |
Used as a variable for different scenarios. |
|
Relay Retransmit Interval |
20 ms |
- |
|
Number of relays |
(a) All relays |
These two distinct cases are explored as different scenarios. |
For the purpose of these tests, we decided to keep Network Transmit Interval and Relay Retransmit Interval fixed at 20 ms. Increasing these values (though helps in reducing the number of collisions) will directly increase the overall latencies.
Test scenarios
Various possibilities exist to execute the tests by varying some of the parameters mentioned in Table 1. However, only some scenarios are most useful and considered here.
In the case of lighting networks, reliability and performance of message delivery matter for the lighting control messages (for example, Generic OnOff Set Unacknowledged message) that are used to control luminaires.
Network Transmit Count and Network Transmit Interval affect the message delivery performance within the immediate radio range from the source node. Relay Retransmit Count and Relay Retransmit Interval affect the message relaying performance for relays.
The following table shows various scenarios that were evaluated for determining the one-way latency and reliability for unacknowledged messages.
|
Scenario |
Number of relays |
Network Transmit Count |
Relay Retransmit Count |
|
1 |
all-nodes |
0 |
0 |
|
2 |
2 |
0 |
|
|
3 |
2 |
2 |
|
|
4 |
limited |
0 |
0 |
|
5 |
2 |
0 |
|
|
6 |
2 |
2 |
In some scenarios, only a few nodes are configured as relays (see Figure 3). The distance between relay nodes is only a few meters, and it is possible to reduce the number of relay nodes to a large extent. However, we decided to go with a simple approach by assigning all nodes in the corridors as relay nodes. The optimization for reducing the number of relay nodes is outside the scope of this post.
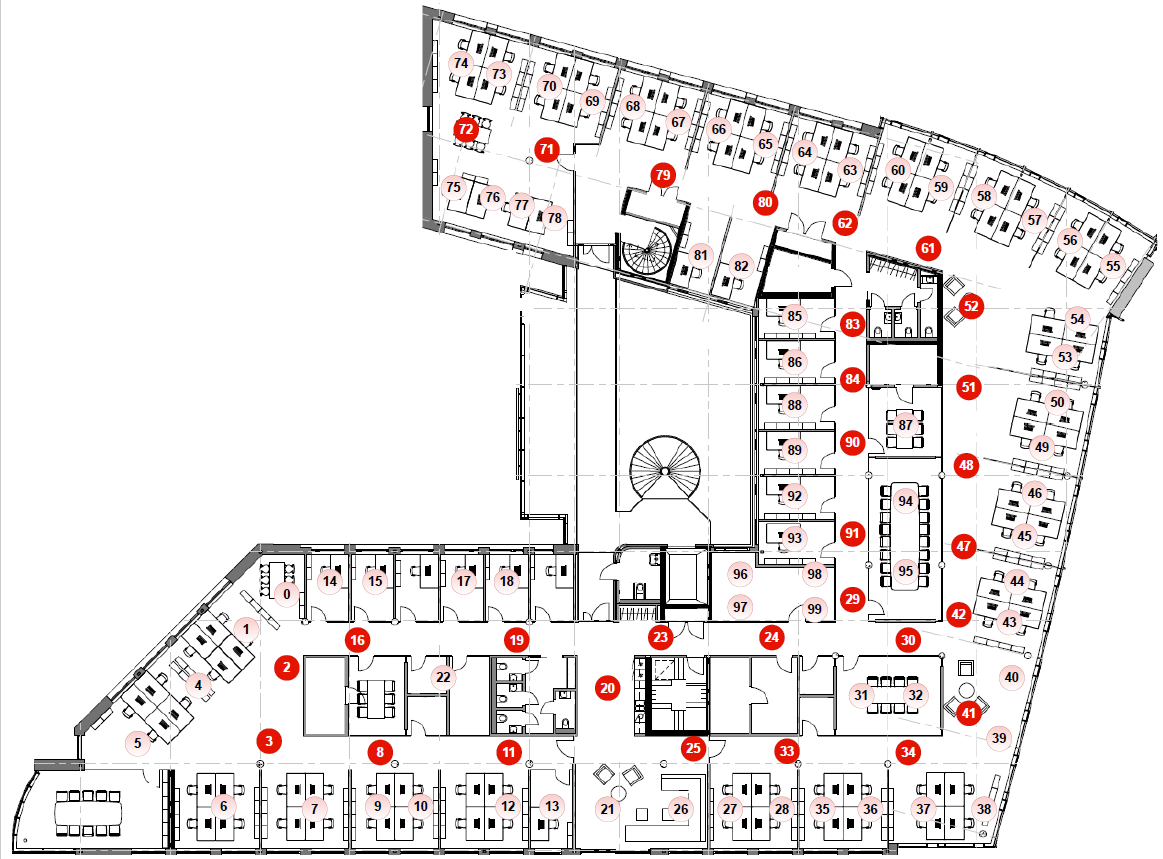
Figure 3: Nodes highlighted in red are configured as relays for ‘limited’ relay scenario
With acknowledged messages
The following methodology is used to conduct latency and reliability measurements using acknowledged messages.
Initial conditions
- The network does not have any traffic other than mesh beacons. Non-mesh traffic in the office environment is expected to be present all the time and is unpredictable.
- The number of iterations (COUNT) for each node is set to 100.
Test procedure
- Initialize the network by flashing test firmware on the nodes. The Firmware sets Network Transmit and Relay Retransmit setting values.
- Pick up one node in the network as a target node.
- Configure publication settings of the tester node to send messages to the selected target node.
- Send a request message and record the timestamp.
- Wait for a response message and compute latency from recorded timestamps.
- Wait for 2 seconds to let message forwarding by relays to finish.
- Repeat steps 4 to 6 for COUNT number of times.
- Collect latency results from the tester node.
- Pick the next node in the network as the target node and repeat steps 3 to 8 until all remaining nodes are covered.
Test constraints
The following table shows the test constraints used while executing the test procedure.
|
Constraint |
Specifics |
Additional information |
|
Access message type |
Unsegmented acknowledged message |
- |
|
Addressing |
Unicast |
A tester node sends a message to a single unicast address on a destination node. |
|
Publish TTL |
5 |
Fixed value is used irrespective of the choice of target node. |
|
Publish retransmit |
0 |
- |
|
Network Transmit Count (NTC) |
<variable> from 0 to 2 |
Used as a variable for different scenarios. |
|
Network Retransmit Interval |
20 ms |
- |
|
Relay Retransmit Count (RRC) |
<variable> from 0 to 2 |
Used as a variable for different scenarios. |
|
Relay Retransmit Interval |
20 ms |
- |
|
Number of relays |
(a) All relays |
These two distinct cases are explored as different scenarios. |
Test scenarios
Various possibilities exist to execute the tests by varying some of the parameters mentioned in Table 3. However, only some scenarios are most useful and considered here.
As before, in some scenarios, only selected nodes are configured as relays (see Figure 3). Scenarios selected for testing are given in Table 4.
|
Scenario |
Number of relays |
Network Transmit Count |
Relay Retransmit Count |
|
1 |
all-nodes |
0 |
0 |
|
2 |
2 |
0 |
|
|
3 |
2 |
2 |
|
|
4 |
limited |
0 |
0 |
|
5 |
2 |
0 |
|
|
6 |
2 |
2 |
Results and discussion
With unacknowledged messages
Latency measurements
All nodes are relays
The following figure shows the plot of the average (mean) latency for each node in the network when all nodes are configured as relays. Plots show combined results for three scenarios - scenarios 1, 2, and 3 as mentioned in Table 4.
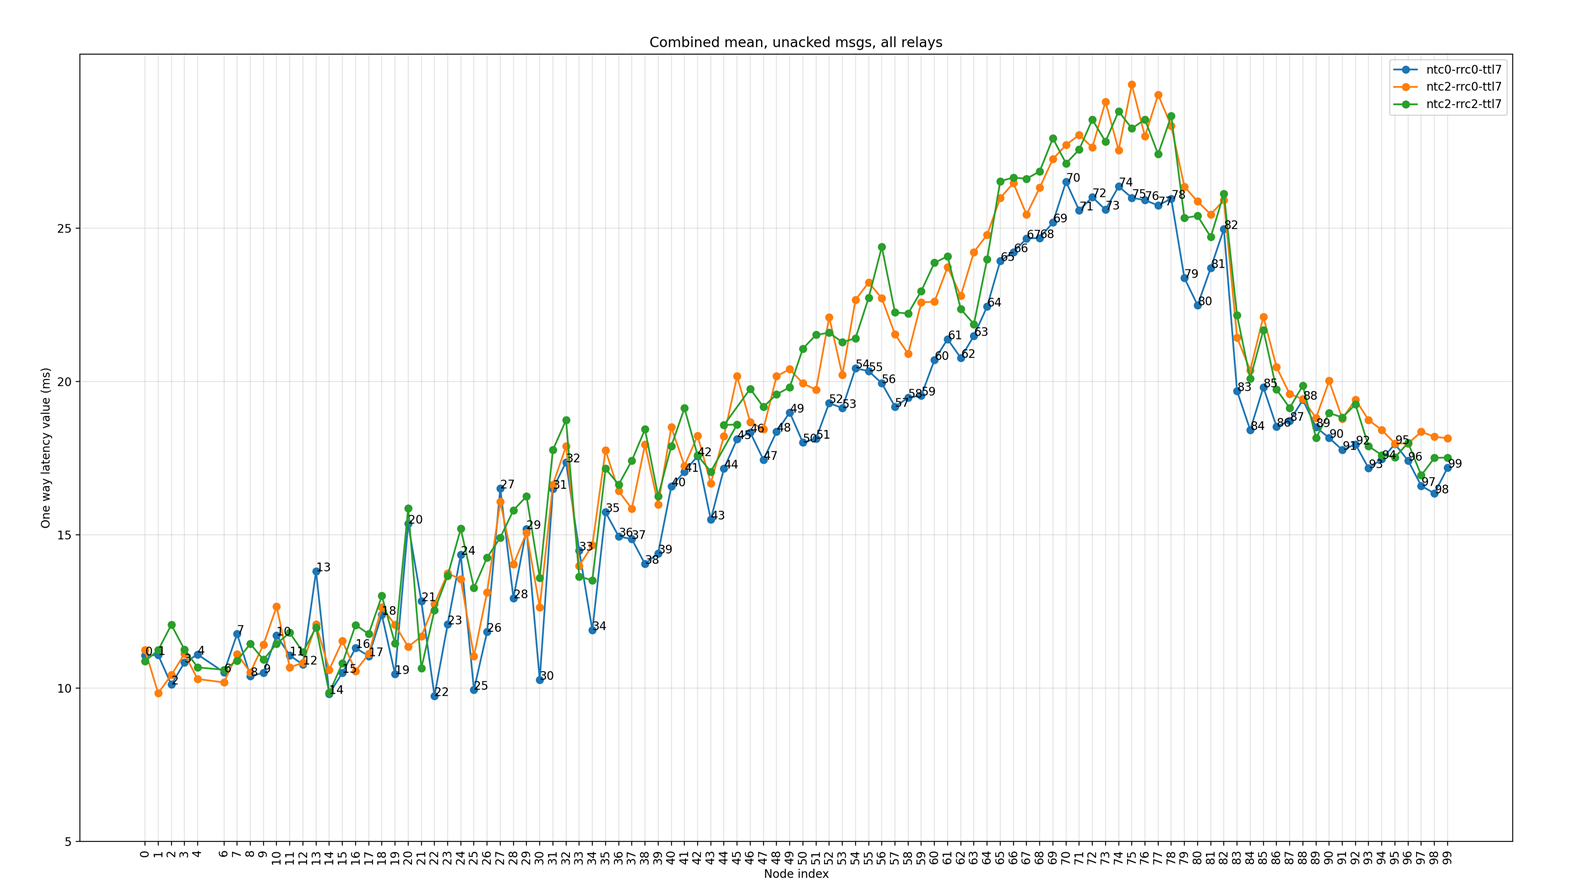
Figure 4: Mean latency (Unacknowledged messages) for each node for three scenarios when all nodes are relays
Inferences
- The latency plot against the node index shows a pattern that matches the topology of the network. As the building floor is ‘C’ shaped, nodes towards the second fork of the floor are farthest away from the tester node in terms of the number of hops.
- Some of the nodes (nodes 20, 23, 26, etc.) have particularly high average latency compared to neighboring nodes. This may be because these nodes are located at such a location that requires more hops for successful message delivery, thereby pushing the average latency higher.
For example, node 20 is located behind several obstacles from the tester (node 5). Therefore, most messages it receives are via slightly more hops compared to node 19 and node 22, which have more direct and shorter paths from the hop before.
- Some of the nodes (nodes 20, 23, 26, etc.) have particularly high average latency compared to neighboring nodes. This may be because these nodes are located at such a location that requires more hops for successful message delivery, thereby pushing the average latency higher.
- For unacknowledged messages, one-way latency performance is fairly uniform across different scenarios of Network Transmit Count and Relay Retransmit Count values.
- This could be explained by the fact that all nodes act as relays, and the test procedure ensures that the overall network is quiet before sending each message.
- Secondly, as no response messages originate from the destination node, the relays in the network do not suffer many collisions while relaying packets.
- However, an increase in Network Transmit Count and Relay Retransmit Count values generates more traffic and slightly degrades mean one-way latency values for some of the nodes.
Some nodes are relays
The following figure shows the plot of average (mean) latency for each node in the network when some nodes are configured as relays (see Figure 3). Plots show combined results for three scenarios - scenario 4, 5, and 6 as mentioned in Table 4.
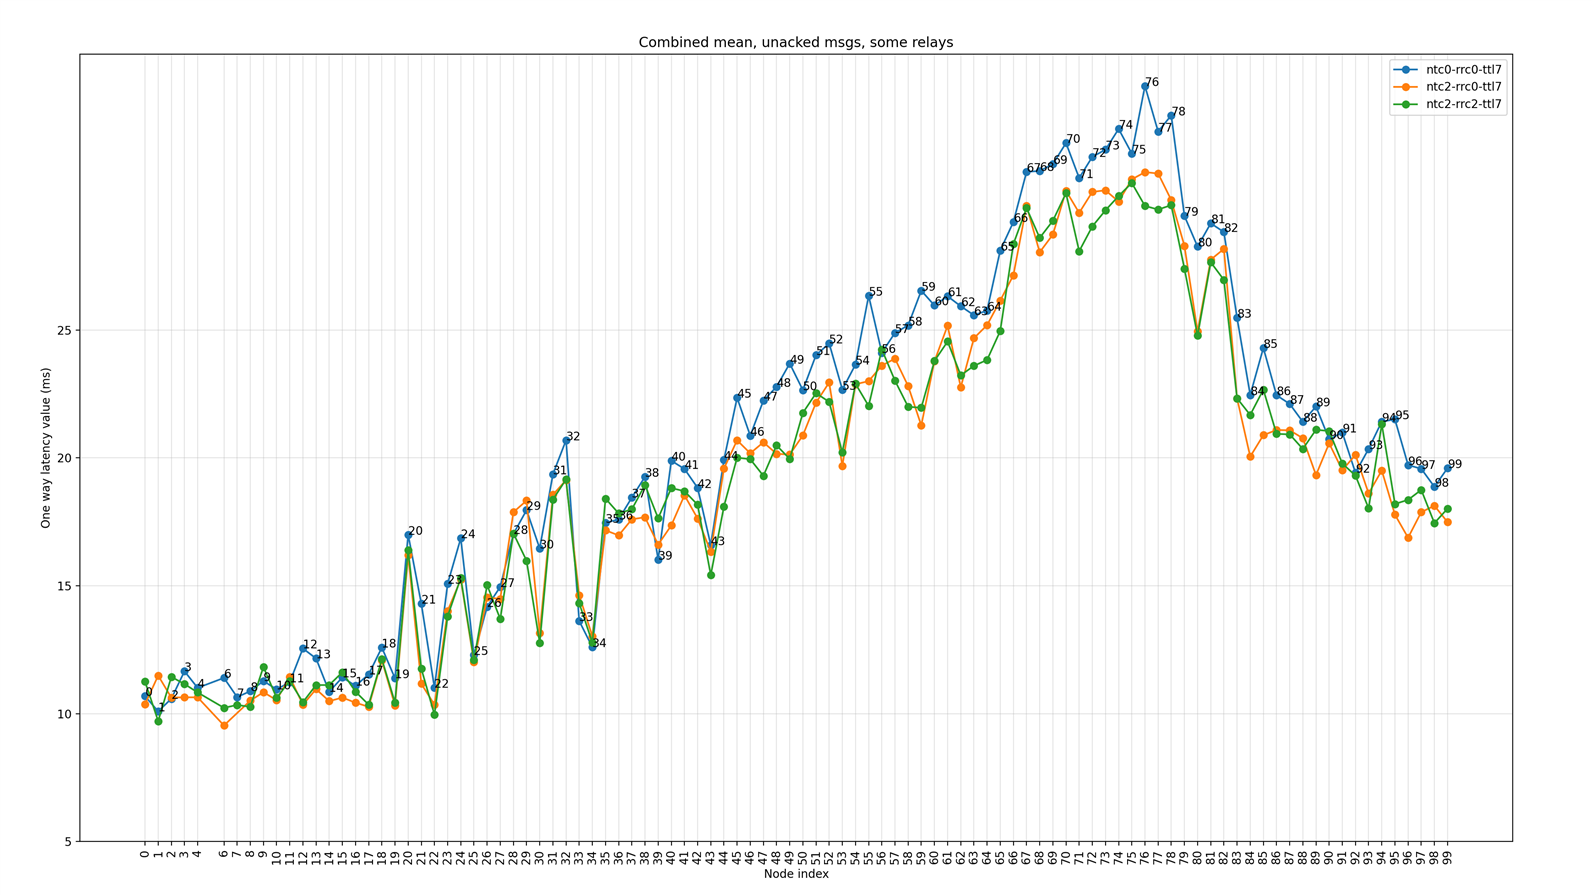
Figure 5: Mean latency (unacknowledged messages) for each node for three scenarios when limited nodes are relays
Inferences
- Fewer relays result in fewer collisions and significantly lower one-way latency for nodes closer to the tester node.
- Also, overall one-way latency numbers for most of the nodes are relatively better in this case compared to the case where all nodes are configured as relays.
- Mean latency when network and relay retransmissions are enabled, are better compared to when these are not enabled. This effect is specially pronounced for farthest nodes indicating that multiple retransmissions may be helping to reduce overall latency when there are multiple paths with several hops, but only in case when burst of traffic is not resulting into more collisions. For example, as seen in Figure 4, where all nodes acting as relays will generate a lot of traffic, pushing the overall latency higher due to collisions.
Reliability measurements
The following table shows the percentage of received messages on target nodes (observed reliability) for all nodes for various scenarios:
|
Scenario |
Number of relays |
Network Transmit Count |
Relay Retransmit Count |
Observed reliability (%) |
|
1 |
all-nodes |
0 |
0 |
100% for all |
|
2 |
2 |
0 |
100% for all |
|
|
3 |
2 |
2 |
100% for all |
|
|
4 |
limited |
0 |
0 |
100% for many, |
|
5 |
2 |
0 |
100% for all |
|
|
6 |
2 |
2 |
100% for all |
Inferences
- It is easy to get 100% reliability for unacknowledged messages, even when Network Transmit Count and Relay Retransmit Count are set to 0. This can be attributed to the fact that no response messages are being sent back to the tester node and this reduces the traffic and collisions in the network.
- For some nodes one or two messages were lost during the test run. This could be due to either of these events:
- The node may be transmitting or receiving a mesh beacon which causes interference with an incoming message.
With acknowledged messages
Latency measurements
All nodes are relays
The following figure shows the plot of the average (mean) latency for each node in the network when all nodes are configured as relays. Plots show combined results for three scenarios - scenarios 1, 2, and 3, as mentioned in Table 4.
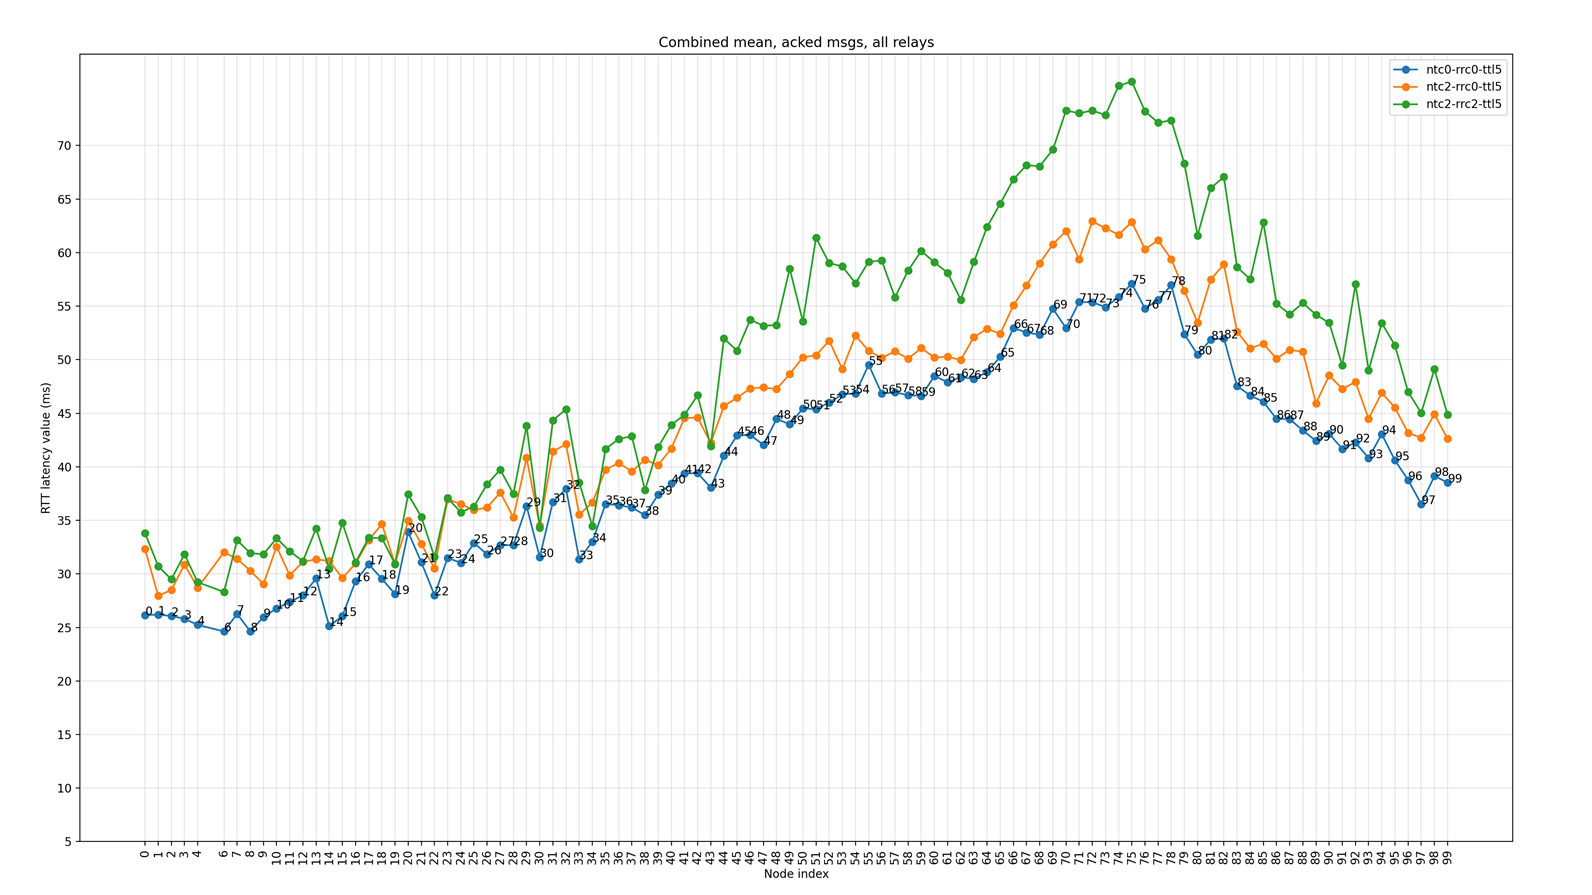
Figure 6: Mean Round Trip Time (RTT) latency (acknowledged messages) for each node for three scenarios when all nodes are relays
Inferences
- The latency plot against the node index shows a pattern that matches the topology of the network.
- There is a marginal difference between the mean latency values for different numbers of Network Retransmission Count values.
- When Relay Retransmit, Count is increased to two:
- Round-trip latency values are significantly high for the nodes further away from the tester node. This is expected as there will be a burst of traffic in the network due to all nodes relaying packets, leading to more interference and loss and hence affecting the average latency.
- Some of the areas have a high concentration of relay nodes (between node index 20 to 36, see Figure 2) since all nodes are acting as relays, causing bursts of traffic and this affects the latency in the neighborhood severely.
- This implies that a reduction in the number of relays is necessary to optimize network performance.
Some nodes are relays
The following figure shows the plot of the average (mean) latency for each node in the network when some nodes are configured as relays. Plots show combined results for three scenarios - scenarios 4, 5, and 6, as mentioned in Table 4.
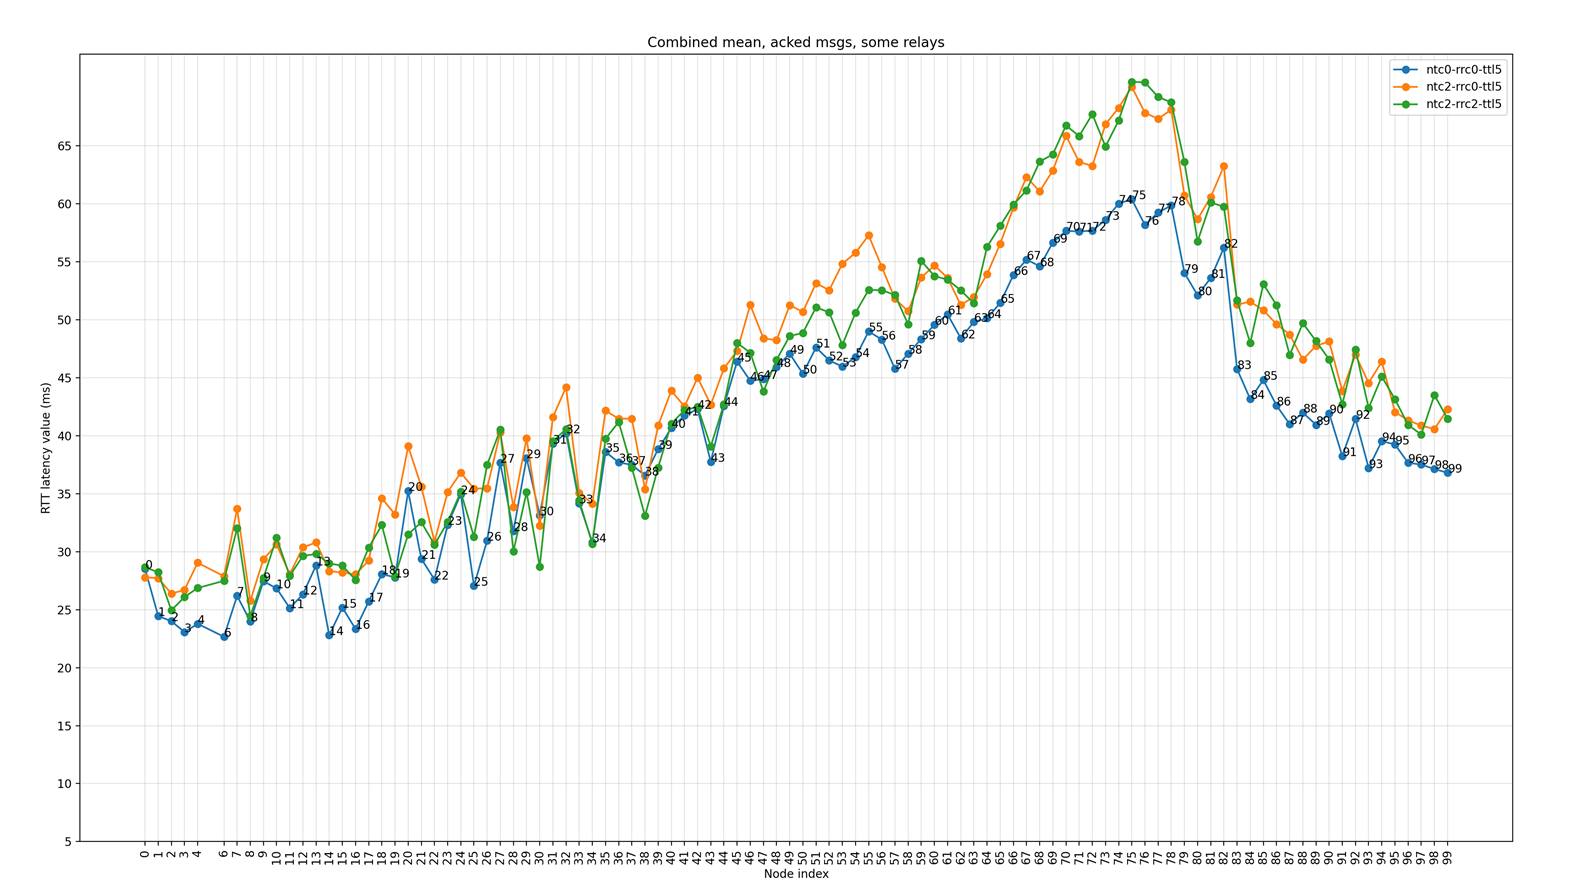
Figure 7: Mean RTT latency (acknowledged messages) for each node for three scenarios when some nodes are relays
Inferences
- When a limited number of nodes are configured as relays, there is some increase in round-trip latency value.
- Many nodes with limited relays around them have reduced round-trip latency values (compared to the previous scenario) as the total number of relays in the vicinity is reduced leading to lesser losses due to collisions. This is specially visible in high traffic scenario (NTC=2, RRC=2) and for some of the farthest nodes.
- However, though the reduction in the number of relay nodes helps reduce overall traffic, for some nodes, the short hops that were available via redundant relays are no longer available. This is especially true for the farthest nodes and increases average latency for those nodes when smaller number of retransmits are used.
- When Relay Retransmit Count (RRC) is increased to two:
- Latency values are more or less similar to the case when RRC was set to zero. Variations could be related to density of relays and distance from the relays for various nodes.
- Some areas still have a high concentration of relay nodes (between node index 20 to 36), which is reflected in higher latency values.
- This indicates that there is still scope for improvement by reducing the number of relays even more and to optimize relay selections.
Reliability measurements
The reliability measurements for acknowledged messages have a limited value. Since each acknowledged message generates a response message, the application logic on the originator can retry sending the acknowledged message if the response is not received within a given time.
To get a clear picture of the reliability when the model layer sends each acknowledged message only once, the test application does not implement retry logic.
All nodes are relays
The following figure shows the plot of the reliability of message transactions (in percentage) for each node in the network when all nodes are configured as relays. Plots show combined results for three scenarios.
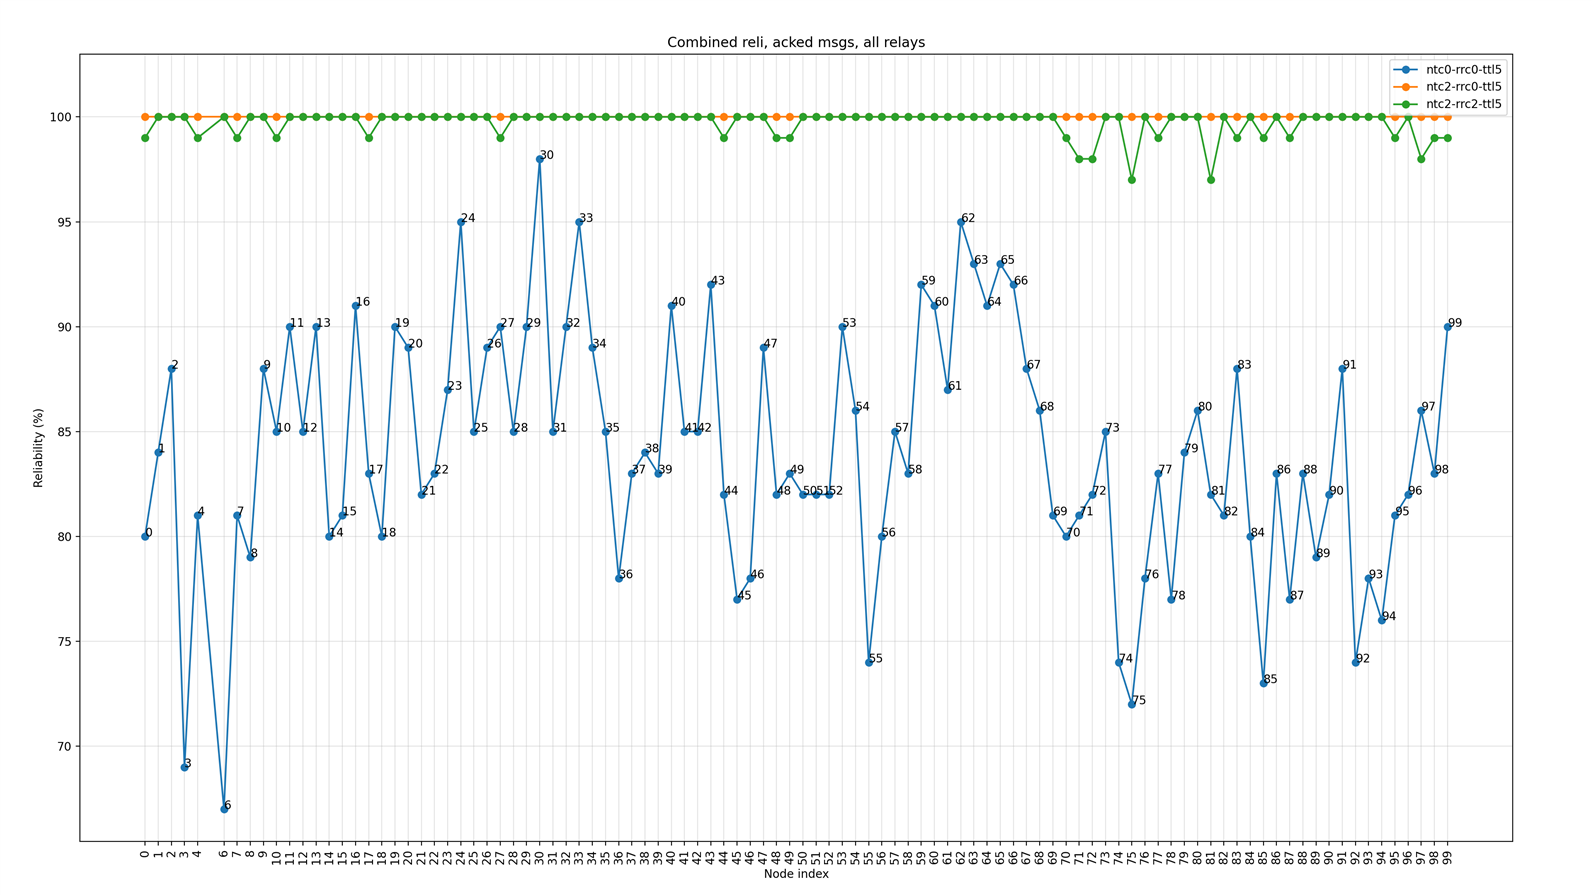
Figure 8: Reliability of acknowledged message transaction for each node for three scenarios when all nodes are relays
Inferences
- As acknowledged message transactions involve receiving a response message, a significant amount of traffic is generated by each acknowledged message and its response message. This increases collisions and in turn, reduces the reliability of single transactions.
- Reliability improves when Network Transmit Count and Relay Retransmit Count are increased. However, a Network Transmit Count of 2 and a Relay Retransmit Count of 2 are still insufficient to guarantee 100% reliability for acknowledged messages for all nodes. In fact, reliability is highest for the Network Transmit Count of 2 and Relay Retransmit Count of 0.
- This highlights the need for model-level/application-level retries to ensure high reliability.
- Higher-layer retries give new sequence numbers to outgoing messages, which are then not subject to network cache filtering in the relays. This can help in pushing the messages through the network. However, this will also increase the overall traffic in the network.
- This highlights the need for model-level/application-level retries to ensure high reliability.
Some nodes are relays
The following figure shows the plot of the reliability of message transactions (in percentage) for each node in the network when some nodes are configured as relays. Plots show combined results for three scenarios.
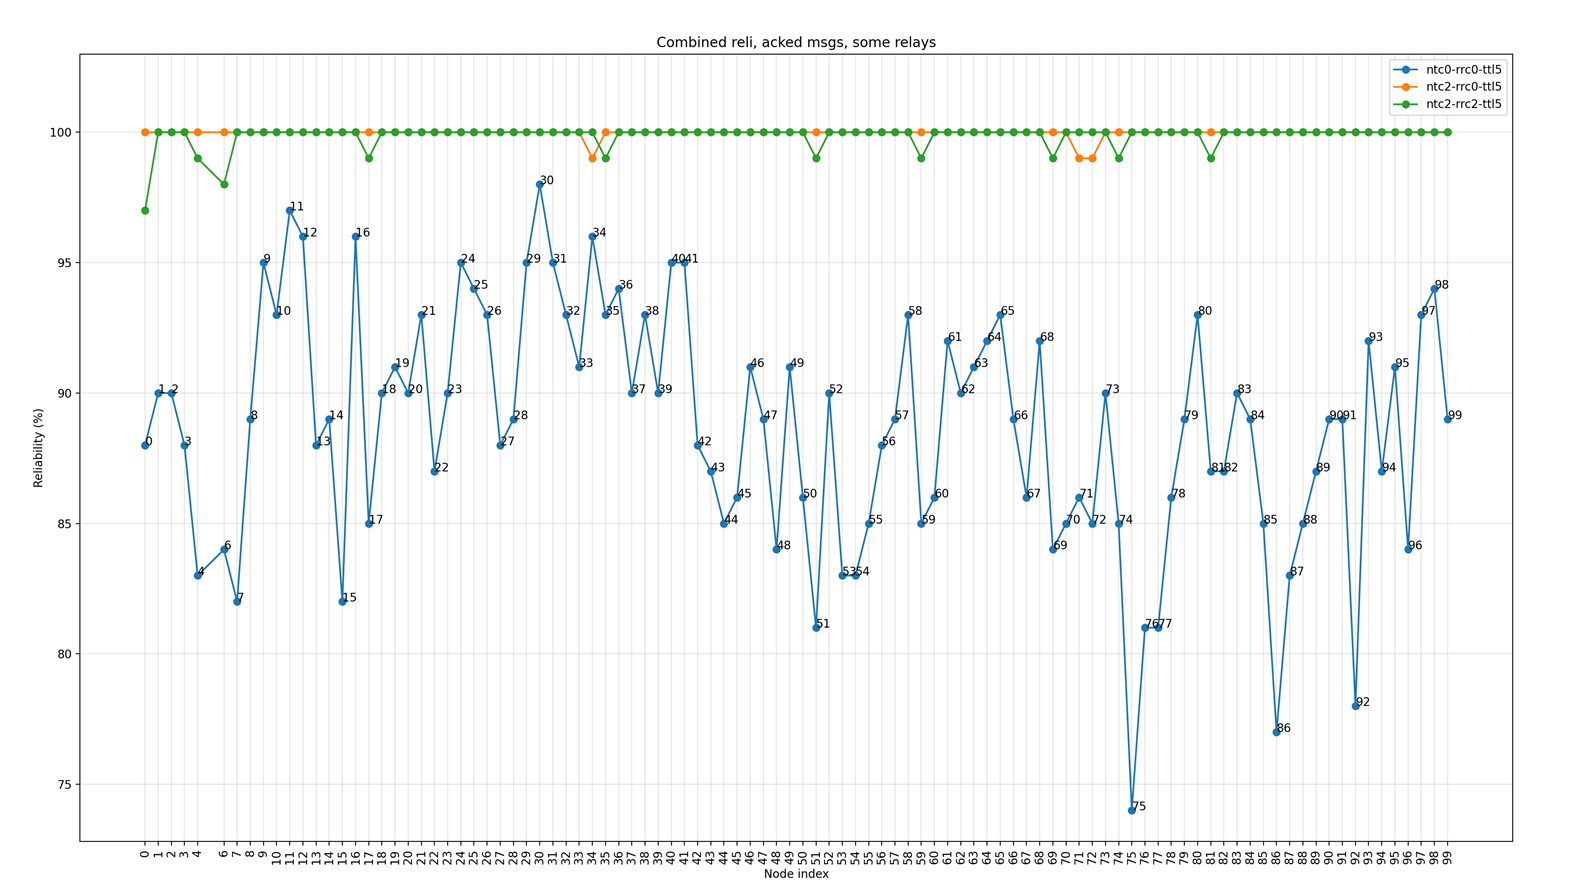
Figure 9: Reliability of acknowledged message transaction for each node for three scenarios when some nodes are relays
Inferences
- As a limited number of relays generate less traffic, the reliability of acknowledged message transactions are better, even when Network Transmit Count or Relay Retransmit Count are set to zero. For higher values of these settings, reliability is 100 %. However, it might drop if too high values are used due to too many collisions. This aspect could be explored in the future.
- Due to the reduced number of relays, some nodes that are farther away from neighboring relay nodes still have poor reliability when no retransmissions are used.
- This shows there is a scope for improvement in relay placement.
- Model-level/application-level retries, and randomization, could help achieve higher reliability when the number of retransmissions is lower.
Closing
The performance tests done on a large Bluetooth mesh network in a realistic environment shows the latency performance of Bluetooth mesh technology implemented in the nRF Connect SDK. Regarding latency and reliability, the unacknowledged message performs better than the acknowledged message within a given set of test constraints.
The results show that it is possible to achieve 100% reliable message delivery in a Bluetooth mesh network through a judicious selection of the amount and placement of relay nodes and message retransmission parameters for originating nodes and relay nodes. The results also show that the network's overall performance depends on the underlying stack, the judicious selection of the mesh stack parameters, and the placement of relays. Measurement of other ambient (non-mesh) Bluetooth advertising traffic while executing the tests, and the average number of hops required to reach a certain node in the network from a tester node, could be done in the future to add yet another dimension for interpretation of the results.
All of the message retransmission parameters and the ability of nodes to become relays, are run-time configurable in Bluetooth mesh technology. This should allow vendors to configure their networks for the best possible performance in a given deployment.
Do you want more content like this? Feel free to like this blog post, and leave a comment below!
Old version of this post for reference:
6237.Large-scale-Bluetooth-mesh-testing_y2023m04_r0.pdf

Top Comments