This blog post introduces Memfault's Device Vitals, a new feature offering firmware teams a streamlined approach to monitoring critical device health and performance indicators.
Memfault is seamlessly integrated into nRF Connect SDK and can be enabled through a Kconfig symbol. By integrating Memfault into their firmware, teams gain comprehensive insights into their deployed devices, facilitating proactive debugging and continuous improvement. With Memfault's integration into nRF Connect SDK, Nordic users can easily implement and leverage these vitals. Following a discussion of Device Vitals, this blog post will cover how to instrument firmware for Nordic’s Thingy:91 prototyping platform to capture these fleet-wide insights.
Table of Contents
What is Memfault?
Memfault is an IoT Observability and Over-The-Air (OTA) platform that helps embedded development teams find faults and ship fixes fast. We support devices across MCUs — both bare metal and RTOSs, as well as Android and Linux-based systems. It works with any connectivity set-up and collects crash data and device health metrics automatically and remotely from every device in your fleet. It’s purpose-built for embedded devices, makes debugging fast and efficient and helps teams understand their products better as they operate in the real world.
Device Vitals: Stability, Battery Life and Connectivity
Device Vitals provide a simple and consistent way for firmware teams to measure the health and performance of firmware and hardware, across their entire fleet of deployed devices. Memfault recently rolled out support in our platform for capturing insights in three key areas: battery life, connectivity, and stability.
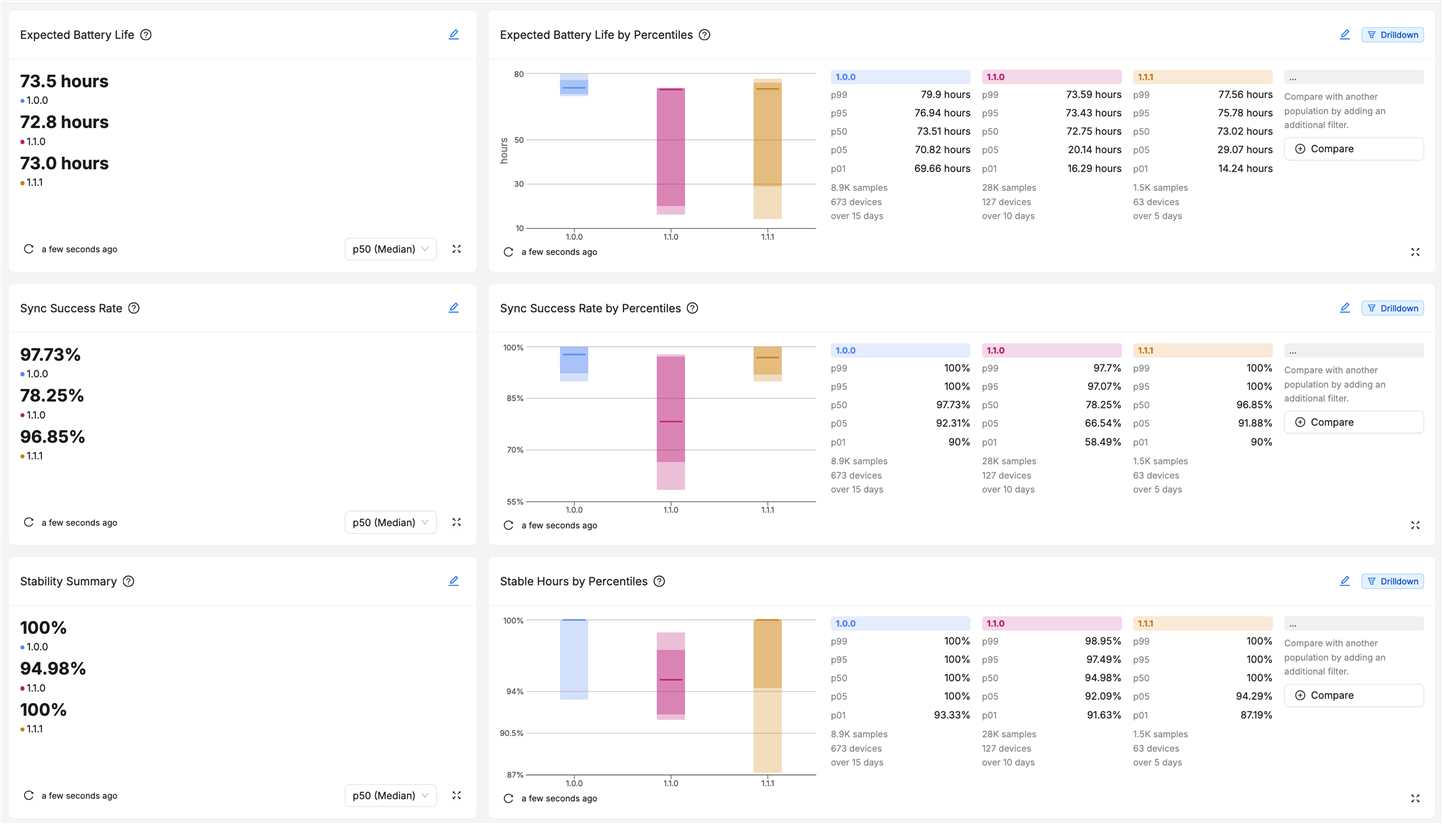
Memfault’s founders are firmware engineers who learned over years developing firmware for consumer electronics that these three Device Vitals were the main areas that required intent focus and performance optimization. For the last 5 years, Memfault has worked with customers who have needed observability in each category to improve the reliability of their fleet. Now, these insights are available out-of-the-box. Once collected, they can then be compared across software versions to see how devices are performing version over version:
Stability
In order for a product to perform its core function, it must be stable. That means it needs to be free from crashes not just most of the time, but as close to 100% of the time as possible. Even if firmware developers wrote perfect code, there are myriad external factors that cause device instability. These factors include varying networks and gateways for connectivity pathways, and environmental factors like temperature and location. Bench testing cannot account for all of these factors, so teams need a way to continuously monitor stability after launch, once devices are operating in the field and exposed to these variables. Memfault captures crash-free hours across all devices by default to calculate an overall stability percentage:
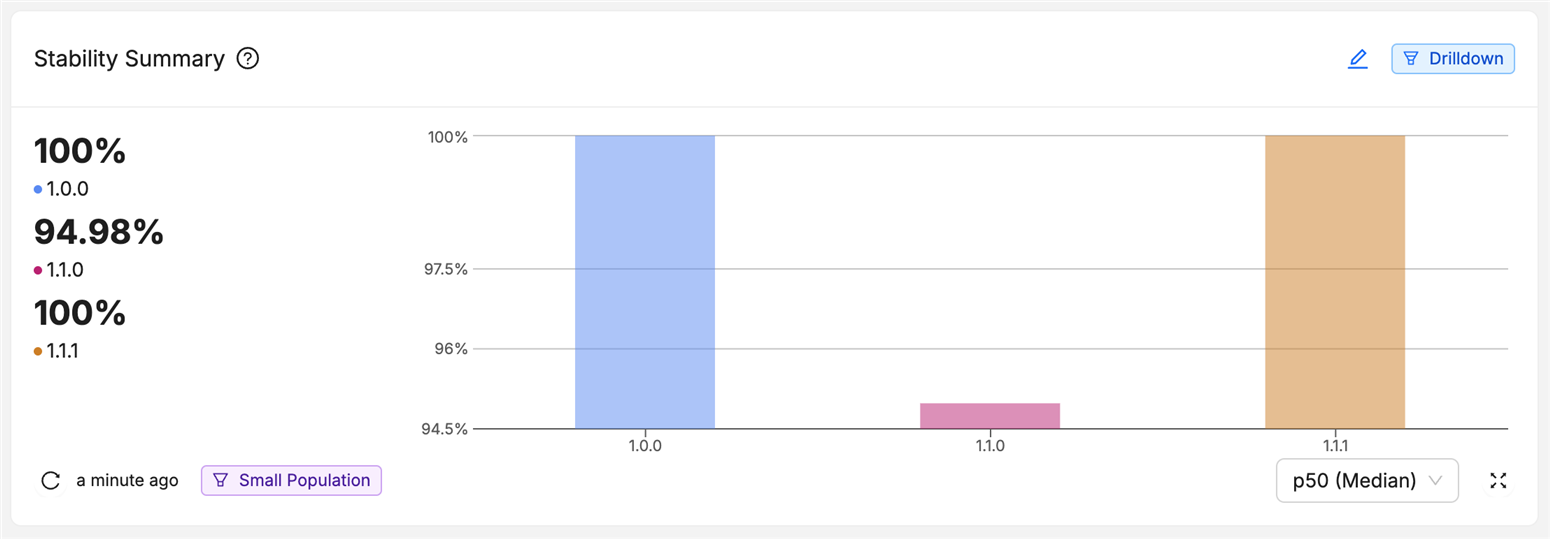
This stability measurement — the percentage of time that the fleet is crash-free — can then be used as a pulse check for how your fleet is performing generally. It can also be used to more specifically quantify the stability of a firmware release. Instead of having a vague knowledge of the success of a new release after say, a new sensor driver was introduced or changes were made to a thread’s state machine, your team can point to the fleet stability metric for devices on that firmware version and say definitively that it is, or is not, affecting fleet stability.
Memfault calculates this stability percentage by computing the ratio of crash-free hours to total operational hours. Some common alternatives to crash-free hours are MTBF (mean time between failure), uptime, crash-free session, and crash-free devices but these have some disadvantages. Memfault chose crash-free hours over these options for a few reasons, the first being that it prevents devices that are rebooting multiple times per hour from skewing the metric drastically. If a device crashes once a minute for an hour, it does not report 60 crashes. It only reports that it was not a crash free hour. The second reason crash free hours is better than other metrics is that you don’t need to wait very long until the data can be aggregated - just a few hours! This is because the metric is gathered hourly instead of daily. For a full analysis of the pros and cons of different stability measures, read through our post on Counting Crashes to Improve Device Reliability.
Connectivity
Connectivity is the central conduit delivering core data to and from users, whether through a Bluetooth LE connection to a phone or gateway, or a direct Internet connection with Wi-Fi or LTE. Therefore, stable connectivity pathways are required for reliably delivering key customer data, not to mention enabling device diagnostics and OTA as well. Everything from your protocol stack to access points introduces complexity and challenges to a device’s data path. Connectivity is the bane of some engineers’ existence — you might be that person pegged to look into Bluetooth LE issues, LTE network disconnects, and asserts in the Wi-Fi stack. When debugging locally, we can use protocol analyzers, verbose log capture, and signal strength metrics. These only focus on individual devices. For fleet-wide connectivity characterization, we need a different metric to understand connection stability.
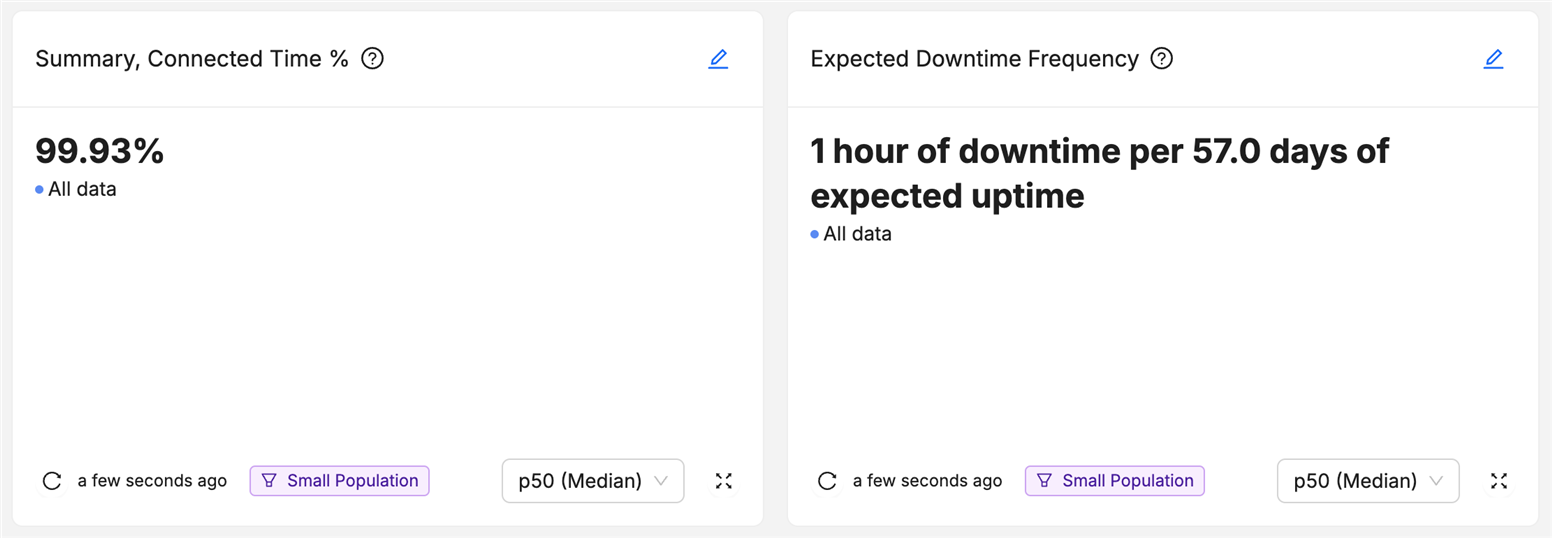
There are two different measures for connection stability, and they depend on your device’s connectivity usage. For always-connected devices, you can use Memfault to capture the connection uptime percentage and identify how your connectivity path is performing across all devices and between firmware releases.
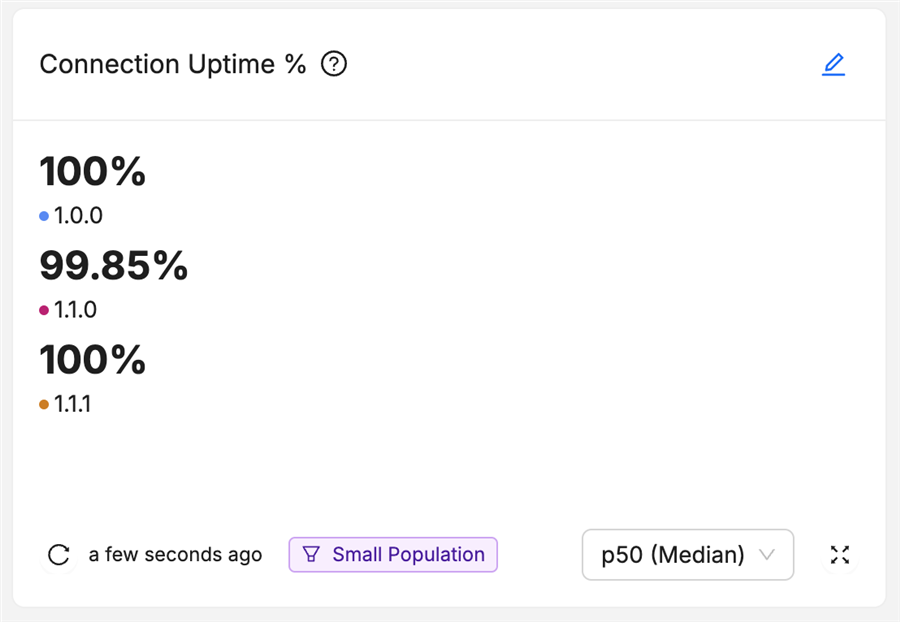
Memfault calculates this uptime percentage by capturing the actual total time connected over the total time expected to be connected. You can enable this data collection using Memfault’s API in the Memfault firmware SDK to update the connection state. Memfault will start and stop timers respectively to capture the actual time connected. Then, the fleet-wide uptime percentage shown is the median of each device’s connection uptime value.
For intermittently connected devices, developers can capture the percentage of successful data syncs to a mobile phone or the cloud. For example, we can see the sync success rate of this fleet of Bluetooth LE-enabled devices:
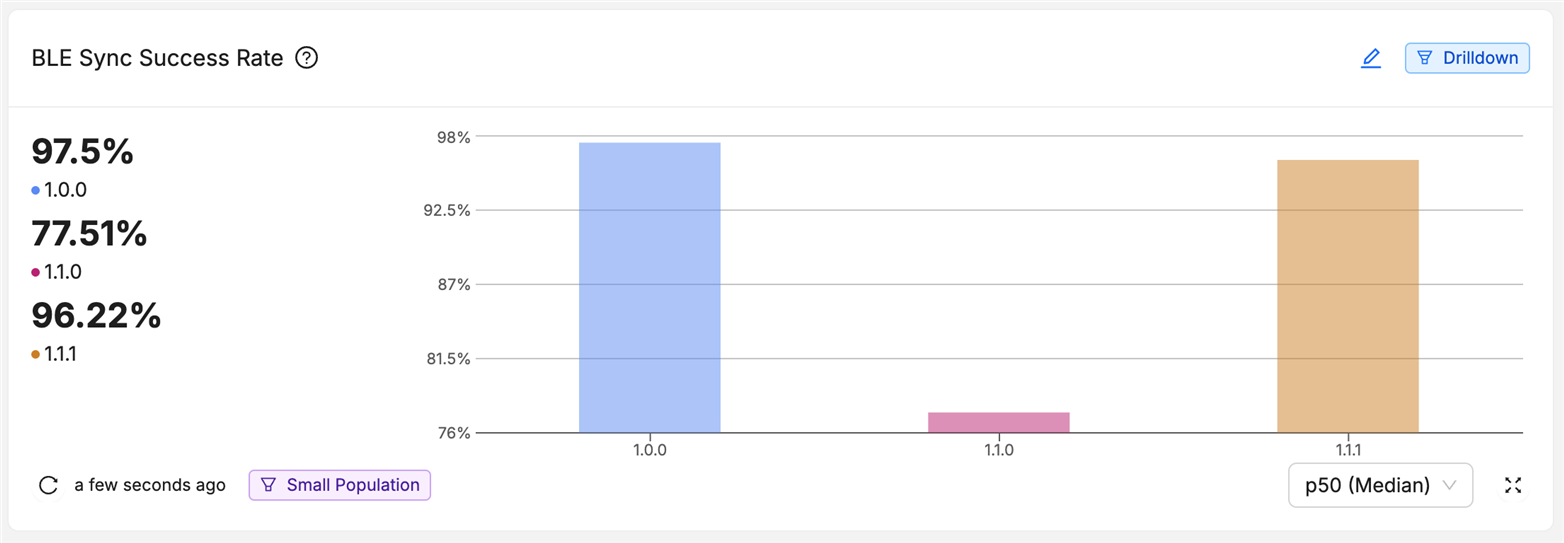
Memfault calculates this sync success rate by counting the number of successful syncs over the total number of attempted syncs, and then determines the median percent across all devices. You can enable this data collection by using another Memfault API to mark sync successes and sync failures. For a fleet-wide view of connectivity performance, these metrics give the best perspective. You can see a more in-depth analysis of different connectivity observation and debugging techniques in our post Best Practices for Monitoring Connectivity.
Battery
Many IoT devices are wireless and portable, so they operate through battery power. For consumer devices, battery life is a key part of the overall user experience. Typically, the longer the battery life, the happier the customer. For more industrial applications, battery life is critical to the success of the device as a whole; for it to operate as intended, it must be left alone and remain operable for a certain number of days, months, or years. That said, teams should be able to measure the battery life across their fleets and know whether it is steady or changing across releases. In Memfault, there is built-in support for calculating the expected battery life across the fleet:
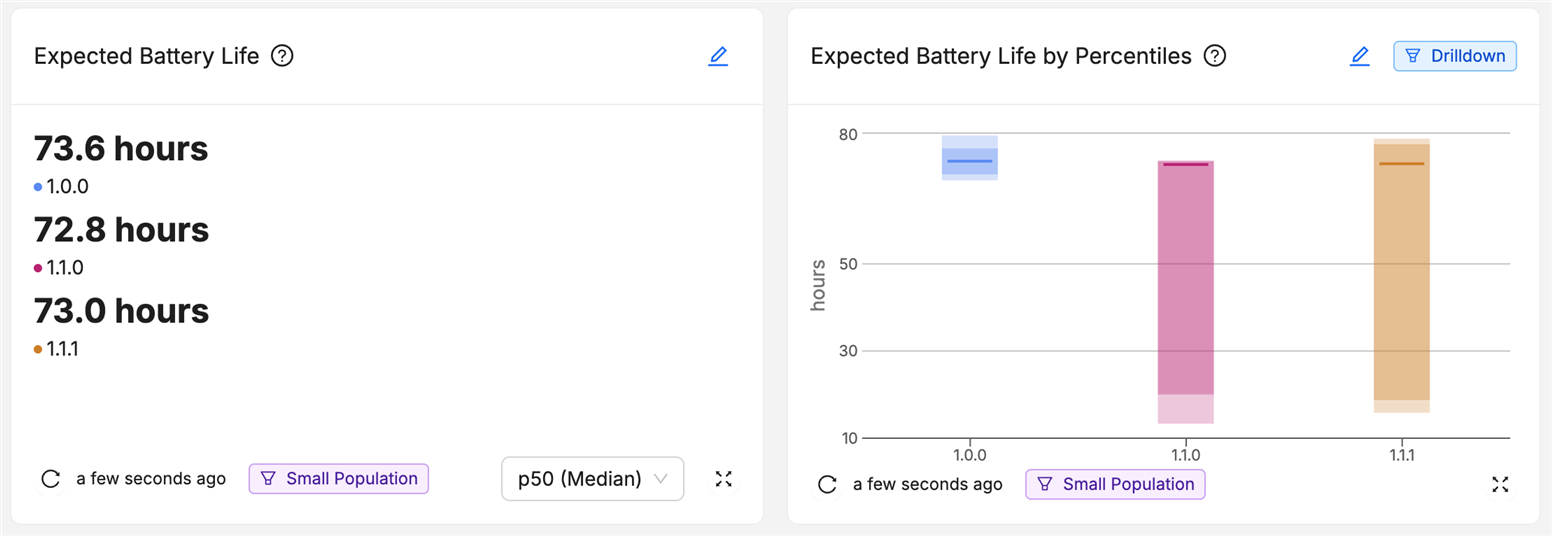
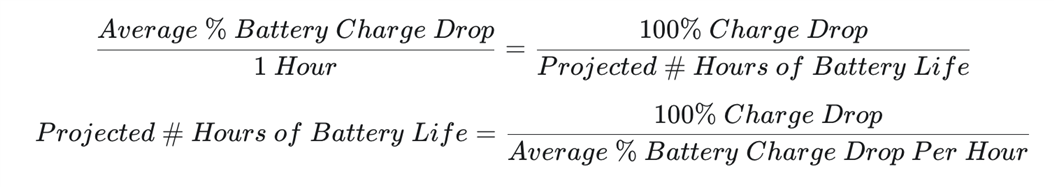
Capturing this insight with Memfault requires implementation of a single function to get the state of charge from your device’s fuel gauge. Then, Memfault automatically calculates this battery life by capturing the average state of charge percent drop over a certain duration and extrapolating this ratio of charge drop per unit of time to determine each device’s expected battery life. For example, if we measure over a duration of one hour, we can calculate a device’s expected battery life:
We can use this to estimate battery life across our fleet. For a more in-depth discussion of capturing battery life metrics on your connected devices, read our post Understanding Battery Performance of IoT Devices.
Using Memfault on your Nordic devices
Memfault and Nordic have developed a partnership to enable developers to combine industry-leading semiconductor technology with the best IoT observability solution available. Memfault is built into Nordic’s nRF Connect SDK so teams can enable the CONFIG_MEMFAULT Kconfig flag and they will be able to collect crash data and metrics immediately over their given transport, whether that is Wi-Fi with the nRF70 Series, cellular with the nRF91 Series, or Bluetooth with the nRF52 and nRF53 Series. Memfault also has robust support within nRF Connect SDK for metrics measuring Bluetooth connections on the nRF52 and nRF53 Series, and LTE connections on the nRF91 Series. For customers using the nRF91 Series modem in particular, initiating and completing firmware over-the-air updates using Memfaut’s OTA management service is supported out-of-the-box.
Getting Device Vitals running on a Thingy:91
The Thingy:91 is a popular platform for IoT prototyping as it is a battery-powered, cellular device housing the nRF9160 System-In-Package. Therefore, all three Device Vitals — connectivity, battery, and stability — can be collected on this platform, by starting from the Asset Tracker v2 application in nRF Connect SDK.
Stability
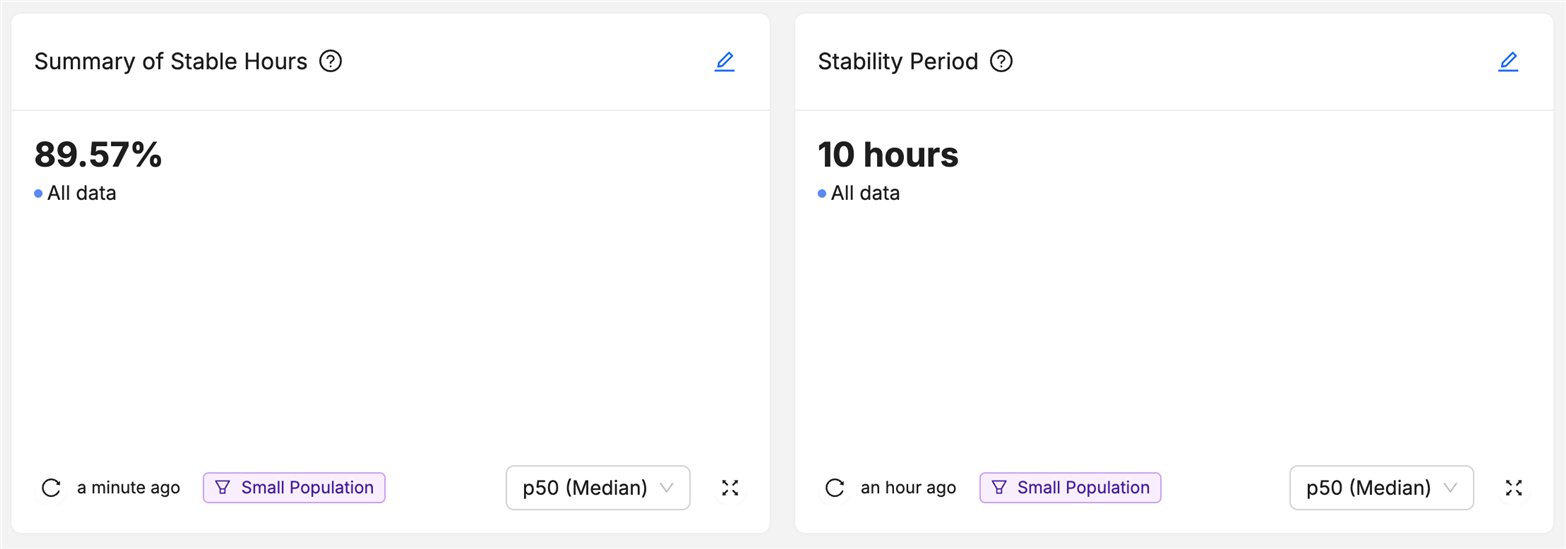
Stability metrics are collected out of the box — there is no configuration required once the Memfault SDK is added to your project. After uploading heartbeat metrics — periodic metrics each device reports — to Memfault, you will immediately see a stability value calculated. Simply navigate to the Stability dashboard in your new project to view the data. After a few weeks of data points, we see this metric more accurately reflects the overall fleet stability:
Connectivity
The Asset Tracker application is an always-connected application, so the project will be leveraging the connectivity uptime % to see what percentage of the time this always-connected cellular device is in fact communicating successfully with the cellular network. To enable that Device Vital, we need to mark when the device connects to the network and when it disconnects. For the nRF91, this is available out of the box in the latest Memfault firmware SDK. We do this by registering a handler with Nordic’s LTE link control library to be notified of network registration status changes:
#include <modem/lte_lc.h>

#include "memfault/metrics/connectivity.h"

static void lte_handler(const struct lte_lc_evt *const evt) {
  enum lte_lc_func_mode mode;
  lte_lc_func_mode_get(&mode);
  MEMFAULT_LOG_DEBUG("LTE mode: %d", mode);

  switch (evt->type) {
    case LTE_LC_EVT_NW_REG_STATUS:
      switch (evt->nw_reg_status) {
        case LTE_LC_NW_REG_REGISTERED_HOME:
          // intentional fallthrough
        case LTE_LC_NW_REG_REGISTERED_ROAMING:
          MEMFAULT_LOG_DEBUG("Connected state: connected");
          memfault_metrics_connectivity_connected_state_change(
            kMemfaultMetricsConnectivityState_Connected);
          break;
        case LTE_LC_NW_REG_NOT_REGISTERED:
          // intentional fallthrough
        case LTE_LC_NW_REG_SEARCHING:
          // intentional fallthrough
        case LTE_LC_NW_REG_REGISTRATION_DENIED:
          // intentional fallthrough
        case LTE_LC_NW_REG_UNKNOWN:
          // intentional fallthrough
        case LTE_LC_NW_REG_UICC_FAIL:
          // only mark as disconnected if modem is supposed to be connected
          if (mode == LTE_LC_FUNC_MODE_NORMAL || mode == LTE_LC_FUNC_MODE_ACTIVATE_LTE) {
            MEMFAULT_LOG_DEBUG("Connected state: connection lost");
            memfault_metrics_connectivity_connected_state_change(
              kMemfaultMetricsConnectivityState_ConnectionLost);
          }
          break;
        default:
          break;
      }
      break;
    default:
      break;
  }
}

//! Call this initialization function on boot
void init_lte_handler(void) {
  lte_lc_register_handler(lte_handler);
}
After building and flashing this to the device, and uploading a heartbeat metric, you can see the connectivity uptime % calculated automatically in the Connectivity dashboard:
Battery
Finally, to collect the state of charge measurements from the Thingy:91 battery, we can use the ADP536X API for the ADP5360 power management IC on the Thingy:91 to read the battery state of charge. Memfault’s backend will use that to calculate the fleet-wide expected battery life. This implementation is also available on Memfault’s adaptation of the Asset Tracker V2 app. This code snippet can be added in an existing module that leverages the ADP5360, or in a module dedicated to monitoring devices and collecting debug information, like the debug module in the Asset Tracker V2 app.
#include <memfault/metrics/platform/battery.h>
#include <adp536x.h>

/* 1 means discharging, 0 means charging, -1 means error */
static int prv_adp536x_is_discharging(void)
{
	uint8_t status;
	int err = adp536x_charger_status_1_read(&status);
	if (err) {
		LOG_ERR("Failed to get charger status: %d", err);
		return -1;
	}
	/*
		bits [2:0] are CHARGER_STATUS states:
		Charger Status Bus. The following values are indications for the charger status:
		000 = off.
		001 = trickle charge.
		010 = fast charge (constant current mode).
		011 = fast charge (constant voltage mode).
		100 = charge complete.
		101 = LDO mode.
		110 = trickle or fast charge timer expired.
		111 = battery detection.

		Only 0b000 means the battery is connected and discharging.
	*/
	return (status & 0x7) == 0 ? 1 : 0;
}

//! Platform-specific implementation of Memfault battery metrics function
int memfault_platform_get_stateofcharge(sMfltPlatformBatterySoc *soc)
{
	int err;
	uint8_t percentage;

	err = adp536x_fg_soc(&percentage);
	if (err) {
		LOG_ERR("Failed to get battery level: %d", err);
		return -1;
	}

	const int discharging = prv_adp536x_is_discharging();

	// failed to retrieve charging status, return error
	if (discharging < 0) {
		return -1;
	}

	*soc = (sMfltPlatformBatterySoc){
		.soc = percentage,
		.discharging = discharging,
	};
	return 0;
}
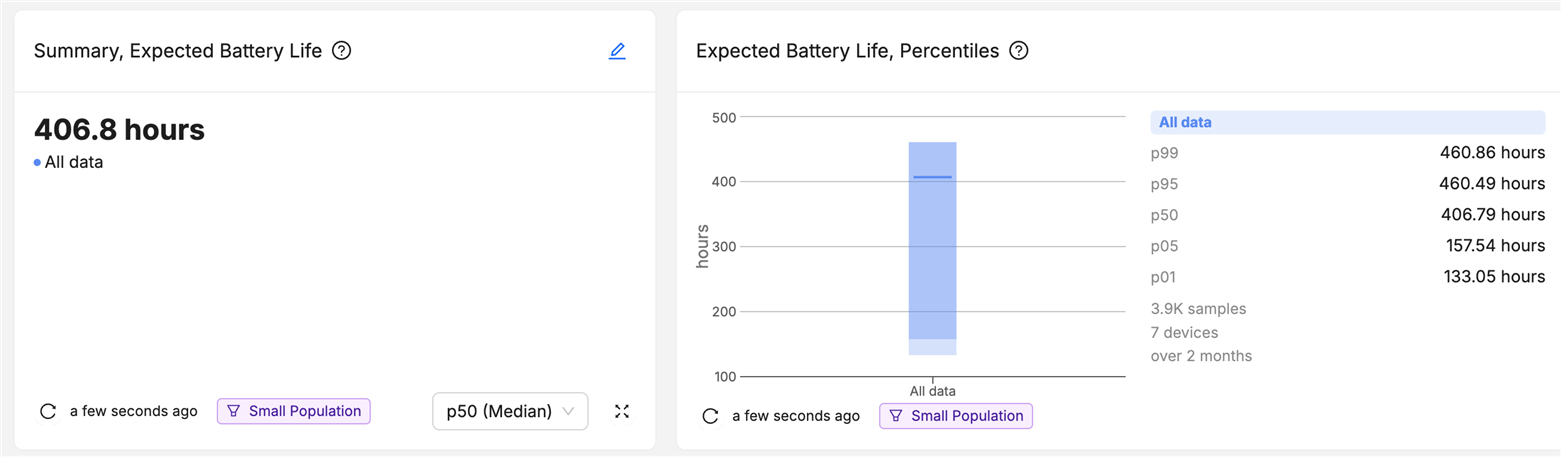
Again, once pushing up heartbeat data you’ll start seeing battery life estimations. Over time with more samples across more devices, you’ll see a realistic value. For example, this is the expected battery life of a Thingy:91 fleet with 7 devices over 2 months:
Running Memfault on other Nordic devices
For a demo and tutorial about getting Memfault up and running in 5 minutes, check out the following Nordic webinar: Accelerate development and optimize in-field device quality with remote debugging and monitoring. For further instructions on getting started with your platform, see Memfault’s nRF Connect SDK Integration Guide.
Closing
Device Vitals packages the best fleet insights for teams to use immediately — stability, connectivity, and battery life — which you can use on any Nordic-based device fleet. With Memfault, Nordic customers can use these vitals right away to understand the performance of their fleets today, start proactively debugging issues, and ship improvements.
Join the Interrupt Slack, a community for embedded engineers, and share your thoughts about Device Vitals, or check out the Memfault app for yourself!