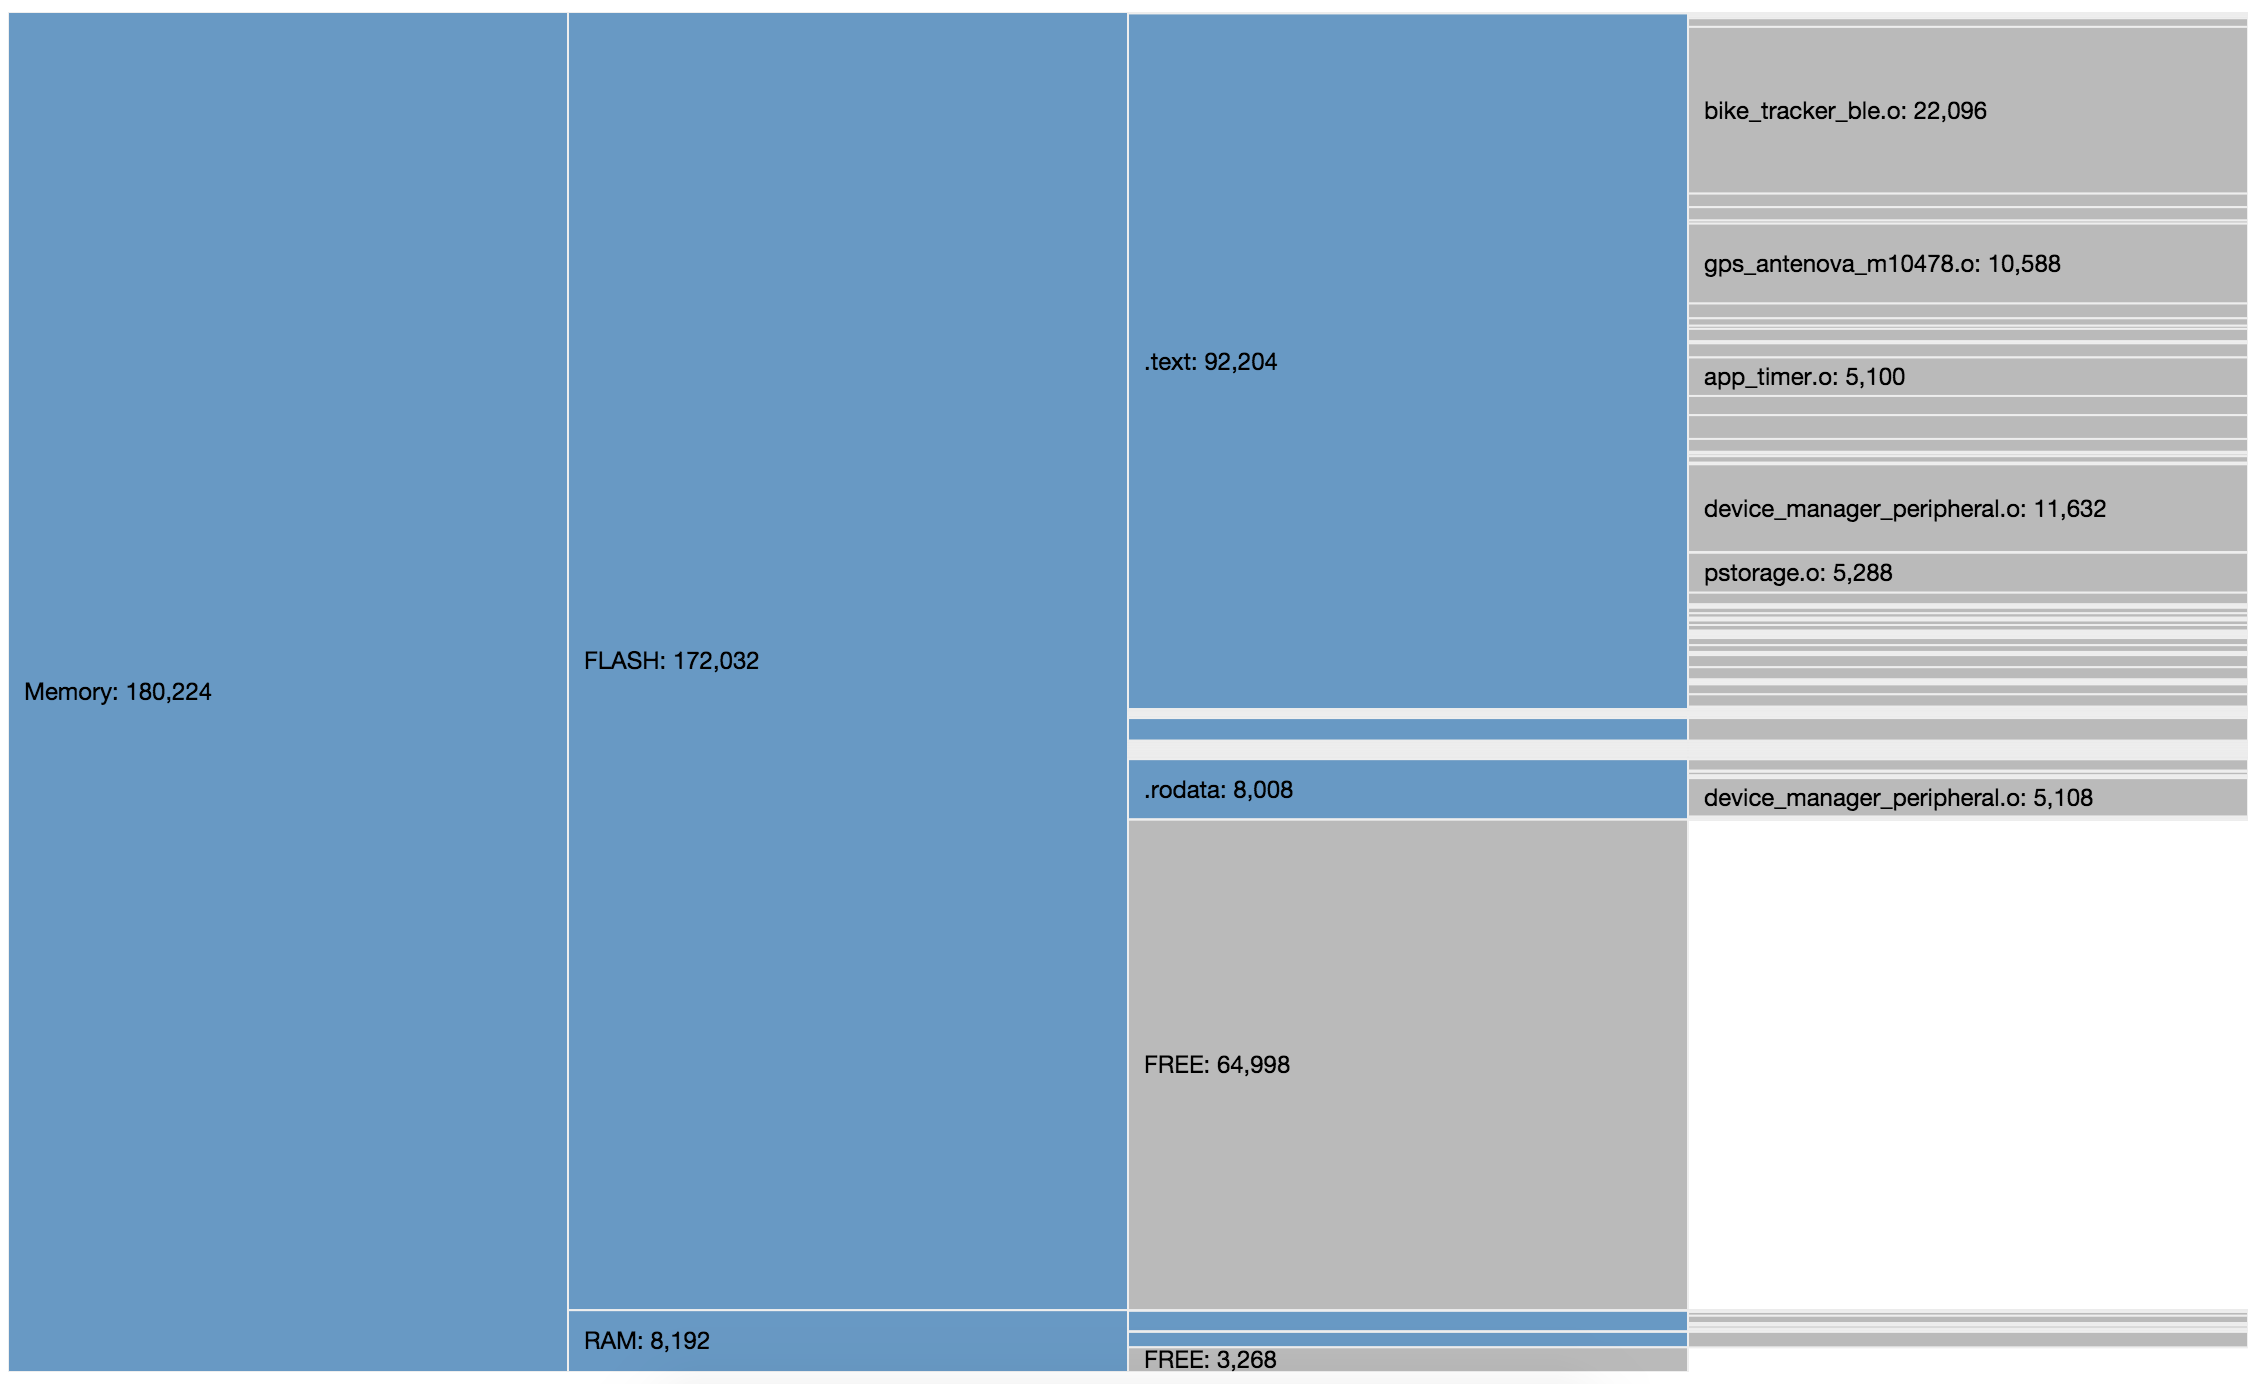
The linker in the GCC toolchain, ld, produces a *.Map file which shows you how the memory on your micro is being used. This file is a goldmine of information but it's a bit difficult for humans to absorb.
I've whipped up a web page which uses the excellent D3.js library to draw a visualisation of your memory usage, using the *.Map file as input. Blocks of memory are drawn proportionally so it's easy to see how much memory you have left and where it's all being used. Click on a block to zoom in on it.
You can run the tool right off the github project page, or download it and modify it for your needs. Pull requests welcome.
https://github.com/eliotstock/memory

Cheers,
Eliot


