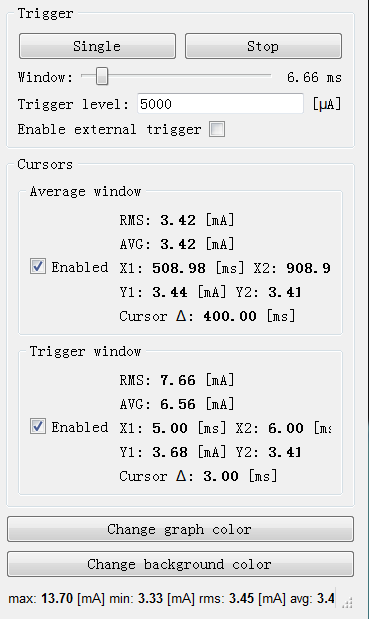
Dear friends, 1) As shown in the pic below, there are some values "max:13.70, min:3.33, rms:3.45..." at the bottom of the pic. which area is these values calculated from? 2) How to use the button "single". Once i click it, do i get a new triggered plot ? That to say,in this way, can i get all the trigered plots? 3) How to combine the two plots to analyze a specified area. If i want to analyze an area of interest triggered within the Average plot, how can i get the detailed plot within the Trigger plot? I am looking forward to your advices. Best Regards.