This post is older than 2 years and might not be relevant anymore
More Info: Consider searching for newer posts

Discovery of Battery service

Hi,

I want to use battery service in my beacon for that i have tried two examples of sdk14 on nrf52 dk

1)ble_app_hrs

2)ble_app_proximity

in first example ble_app_hrs values decrease 100% to 99% then 98%.....till 81% then increment 81%then 82%....100% then again start to decrease when notification is enable.

in second example ble_app_proximity values changes from 4% to 3% and vice-versa .

How can i calculate actual battery percentage?

  • ble_app_gls has same output as ble_app_hrs but disconnects when reach at 96%

    i am uploading sdk14 hex file directly to nrf52 dk

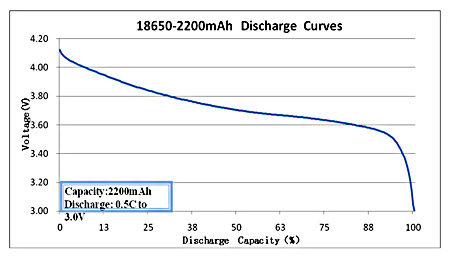
  • I am assuming this is a Li-Ion battery because those are very normal. Normally with State of Charge (SoC) (% of energy you have left in the battery), what happens is that you sample a voltage using SAADC on the nrf52 for example. Take a look at these two links for more info on measuring voltage (link 1 & link 2) Then, you have a lookup table that equates certain voltages with certain % SoCs.

    see this relationship here

    What is happening in the image above is that a battery is being discharged completely at a constant current (often C/30 for example to minimize hysteresis). This means that it takes 30 hours to go from full charge to a completely discharged battery. If you are using a non-rechargeable coin cell battery, that is the end of the test, as the battery is dead. If you are using a rechargeable Li-Ion battery, then you run a charge test too (essentially the same as the discharge test, only opposite). The whole time you are discharging and charging the battery, you want to measure the voltage, time in seconds, and accumulated Ampere hours (Ah). You can also measure the current, but it is almost constant, so this is not so important. From the voltage and accumulated Ah, you are able to measure the real capacity of the battery. Even though a regular coin cell battery has 250 mAh for example, it will often have a greater capacity if you discharge at a very low current (like C/30). If you discharge at a high current, the capacity decreases. The same is true if it is very cold (hence why electric vehicles have shorter range at lower temperatures like we have here in Norway).

    If you are using a coin cell battery, I would recommend one of two situations:

    either you can assume a linear profile (i.e. you know the max voltage of the battery, the min voltage & then you assume everything is linear in between). This is an "ok" solution at best because as you can see in the figure above, the curve is not linear at all.

    My preferred solution would be to checkout the datasheet of you coin cell battery and hopefully there will be a discharge profile. In the example shown, it shows discharge characteristics for different loads. By assuming the nominal capacity is correct (even though it can vary at different temps and current discharge rates), you can "measure" the ampere hours in a semi accurate way. Then, you can make your own lookup table that correlates a specific voltage with a specific state of charge. So if you had 101 values, you could have one voltage for each percent SoC.

    If you want a slightly more advanced model, you could do the battery test described above by using the ADC on the nrf51 beacon to measure voltage. You might need a couple of coin cell batteries then (at least two). One to do the battery test with and the other one to put in your beacon afterwards.

    This link could also be helpful if you are very interested. If you want to learn more about Li-Ion batteries in general and very advanced and accurate SoC estimation techniques, I can highly recommend looking at Prof. Gregory Plett's website. For example ECE5710 & ECE5720 classes. His two books are also super good (book 1 & book 2)!

    As the beacon uses very little current, it is overkill to look at advanced methods like extended kalman filtering using nonlinear battery models. However, such methods are very useful for applications like electric vehicles (especially an EV with a powerful motor like a Tesla), as much more current is being discharged & charged into the battery pack. Then, effects like hysteresis & linear polarization come into play. In this case, it is not enough with "only" a voltage vs SoC lookup table.

  • Note: When I refer to battery voltage, I am referring to the open circuit voltage of the battery (i.e. voltage without any load attached to the battery).

  • The ble_app_hrs app is just showcasing fake heartrate data. So it is supposed to show a triangular sine wave between 100% & 80%.

Related