This post is older than 2 years and might not be relevant anymore
More Info: Consider searching for newer posts

How to trace back hard fault handler

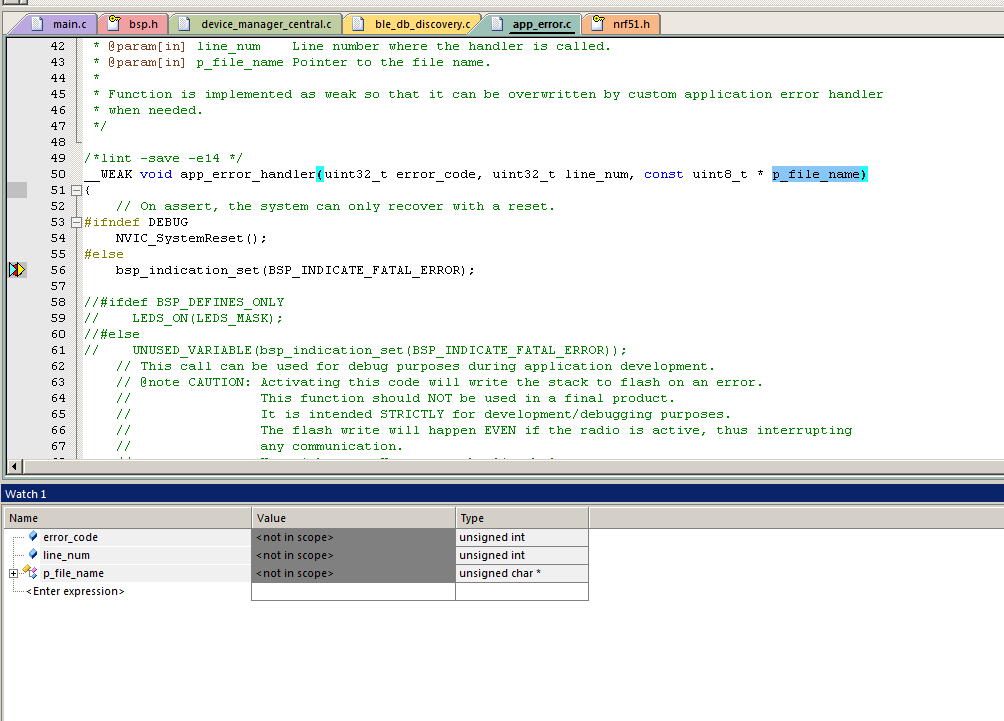
What's the proper way to debug what's causing my eval board to reset? I'm assuming I need to put a breakpoint in the hard fault handle, but how do I trace that back to the source of the error? Or should I modify the handler?

I also noticed that the breakpoint in the hardfault handler isn't triggered unless I step through the code line-by-line. Is this expected?

image description

  • I don't know if this is proper method, but my method of checking what causes hardfault is just by setting breakpoint on hardfault handler. When it triggers, I just check call stack to check which function caused it... Can you find exact line of code that causes hardfault? Or is it in SD?

    Edit. Try turning optimization off and debug again. Or maybe it's some time-related problem... Can You check call stack when you get in hardfault handler?

  • You said that something causes your eval board to reset. Hardfault handler given by Nordic SDK does not cause reset. Search your project for NVIC_SystemReset and put a breakpoint there. You should see the call stack in Keil to tell you how it ended up there. If the call stack isn't pointing to anything sensible then check go to memory (after hitting th breakpoint) and type 'SP+0x14' It will give you exact code address of the function (stack push operation of LR register) that caused it. infocenter.arm.com/.../index.jsp

    once you get the code address from the memory (value at SP+0x14) you can look into .map file generated for you application and find out which function is located at that code address

    If there are no soft reset in your project then check if the board is getting enough power. There is a register NRF_POWER->RESETREAS, which should tell you the reason of current reset.

    If you are using softdevice, then you cannot step through the code without doing some tricks. below are the search results for more information on that. This one, and this one.

  • You're right, I realize now that it is in fact the soft reset that's occurring be cause I did not have the DEBUG define enabled and the APP_ERROR_CHECK was actually calling a reset by default.

    When I check what called the NVIC_SystemReset I discovered that it was the APP_ERROR_CHECK in the notif_enable() function. Now that I've added added the 'DEBUG' define I'm trying to step through app_error_handler() but all the variables in here (error_code, line_num, p_file_name) are all shown as not in scope in Keil.

    I have all optimizations disabled now- how can I find out what the error is and how to fix it?

  • when optimizations are set to level0, your local variables should be in scope when you are stepping the the function where these variables are defined. Can you give me a snapshot of not_in_scope thing that you see?

  • Optimization is set to level 0. I've attached the screenshot in the original post.

Related