
Here is my backtrace
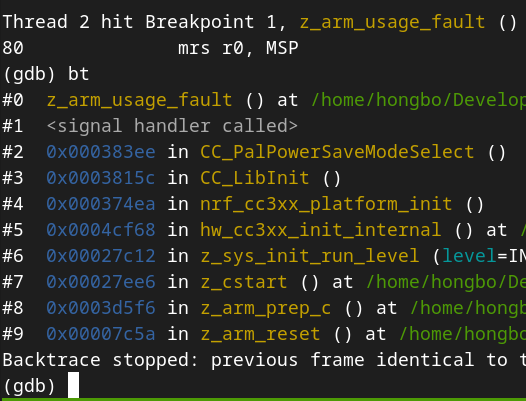
Here is my schematic design:
8585.nrf52840-lte-tracker-nRF52840.pdf
I measured VDD_nRF is 1.8V
The code was running on nRF52840 DK
here is my build .conf
Here is my backtrace
Here is my schematic design:
8585.nrf52840-lte-tracker-nRF52840.pdf
I measured VDD_nRF is 1.8V
The code was running on nRF52840 DK
here is my build .conf
Hi Hongbo,
Thanks for checking with us about this issue.
Do you mean this issue only appear on your custom board, same codes running on nRF52840DK is OK?
Are your codes are based on a specific NCS samples in Samples — nRF Connect SDK 2.6.1 documentation (nordicsemi.com)?
I see a similar report on Kernel usage fault when using semaphore with multi-threading · Issue #41963 · zephyrproject-rtos/zephyr (github.com), could you try the solution mentioned in https://github.com/zephyrproject-rtos/zephyr/issues/41963#issuecomment-1023920219 ?
Best regards,
Charlie
Are the `CC_` functions inside binary lib provided by nordic which I cannot trace into ?
I'll try it later.
Will non-function 32Mhz crystal cause similar fatal errors ?
My main stack had been increased to 8K to support my application before, and have disabled all other application code.
Now it showed this:
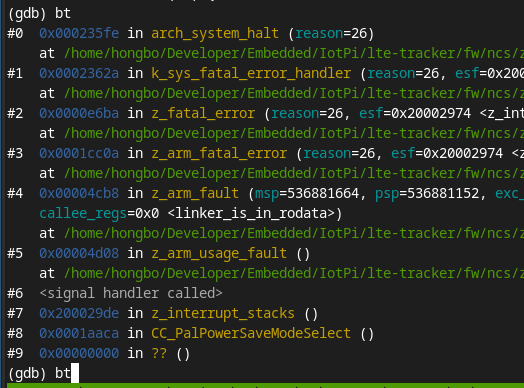
I checked the definition, it is "K_ERR_ARM_BUS_IMPRECISE_DATA_BUS"
Found the reason:
I used the debug output from a nRF52832 DK, for some reason, it debugged onboard nrf52832 instead external nRF52840.
I read the FICR INFO registers to find it out.
Then a question is: doesn't JLink verify Chip ID before entering debug status ?
Yes, it should. JLink only support chips listed at Supported Devices - J-Link (segger.com).
You can see the following log when I start a debug process for nRF9160. It will read out the chip "Target related settings".
JLinkGDBServerCL: SEGGER J-Link GDB Server V7.94e Command Line Version
JLinkGDBServerCL:
JLinkGDBServerCL: JLinkARM.dll V7.94e (DLL compiled Jan 15 2024 15:18:46)
JLinkGDBServerCL:
JLinkGDBServerCL: -----GDB Server start settings-----
JLinkGDBServerCL: GDBInit file:                  none
JLinkGDBServerCL: GDB Server Listening port:     62038
JLinkGDBServerCL: SWO raw output listening port: 2332
JLinkGDBServerCL: Terminal I/O port:             2333
JLinkGDBServerCL: Accept remote connection:      localhost only
JLinkGDBServerCL: Generate logfile:              off
JLinkGDBServerCL: Verify download:               off
JLinkGDBServerCL: Init regs on start:            off
JLinkGDBServerCL: Silent mode:                   on
JLinkGDBServerCL: Single run mode:               on
JLinkGDBServerCL: Target connection timeout:     0 ms
JLinkGDBServerCL: ------J-Link related settings------
JLinkGDBServerCL: J-Link Host interface:         USB
JLinkGDBServerCL: J-Link script:                 none
JLinkGDBServerCL: J-Link settings file:          none
JLinkGDBServerCL: ------Target related settings------
JLinkGDBServerCL: Target device:                 nRF9160_xxAA
JLinkGDBServerCL: Target device parameters:      none
JLinkGDBServerCL: Target interface:              SWD
JLinkGDBServerCL: Target interface speed:        12000kHz
JLinkGDBServerCL: Target endian:                 little
Best regards,
Charlie

