
I have been able to identify and repeat an issue with the nrf tools via VS Code. The problem, is that after I build and debug one time, any subsequent attempt to flash the HW (nrf9160 dk) results in the following error message (below). I have included the part of the log that shows the flash working the first time.
 *  Executing task: nRF Connect: Flash: dect-demo/build (active)

Flashing build to 960084282
/bin/sh -c west flash -d /Users/jpnorair/.../build --skip-rebuild --dev-id 960084282

-- west flash: using runner nrfjprog
-- runners.nrfjprog: Flashing file: /Users/jpnorair/.../build/zephyr/merged.hex
[ #################### ]   4.555s | Erase file - Done erasing
[ #################### ]   1.110s | Program file - Done programming
[ #################### ]   1.024s | Verify file - Done verifying
Applying pin reset.
-- runners.nrfjprog: Board with serial number 960084282 flashed successfully.
 *  Terminal will be reused by tasks, press any key to close it.

 *  Executing task: nRF Connect: Flash: dect-demo/build (active)

Flashing build to 960084282
/bin/sh -c west flash -d /Users/jpnorair/.../build --skip-rebuild --dev-id 960084282

-- west flash: using runner nrfjprog
-- runners.nrfjprog: Flashing file: /Users/jpnorair/.../build/zephyr/merged.hex
[ #################### ]   4.213s | Erase file - Done erasing
[error] [ Client] - Encountered error -102: Command program_file executed for 205 milliseconds with result -102
[error] [  nRF91] - The write access failed, but no cause could be determined.
[error] [  nRF91] - It may be due to an unaligned access, accessing a nonexistent memory, or a communication issue.
[error] [  nRF91] - Failed while performing Write operation on target address 656.
-102: An unknown error.
[error] [  nRF91] - Failed while reading device information.
[error] [ Worker] - An unknown error.
ERROR: JLinkARM DLL reported an error. Try again. If error condition
ERROR: persists, run the same command again with argument --log, contact Nordic
ERROR: Semiconductor and provide the generated log.log file to them.
NOTE: For additional output, try running again with logging enabled (--log).
NOTE: Any generated log error messages will be displayed.
FATAL ERROR: command exited with status 33: nrfjprog --program /Users/jpnorair/.../build/zephyr/merged.hex --sectorerase --verify -f NRF91 --snr 960084282

 *  The terminal process terminated with exit code: 33.
 *  Terminal will be reused by tasks, press any key to close it.
I'm using an M1 Mac, and I've reviewed the results of the following tickets, which have some similarity. My experience is different, because I have no trouble identifying/detecting the device or using the NRF programmer tool.
NRF Connect - Programmer Fails to Connect to Device 9160-DK JLINKARM_DLL_COULD_NOT_BE_OPENED
I can, however, acknowledge that the issue seems to be in the 'nrfutil-device' program. This program is getting stuck, and it needs to be terminated. I can workaround the issue by the following means:
- Quit VScode
- terminate 'nrfutil-device'
- turn off devkit
- turn on devkit
- restart VScode
Then, I can get one more flash to the target.
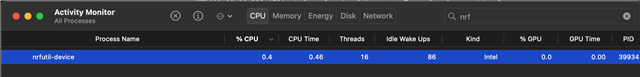
Here is a screenshot of 'nrfutil-device' in my activity monitor, hanging around after I quit VSCode. It's an intel-binary app.
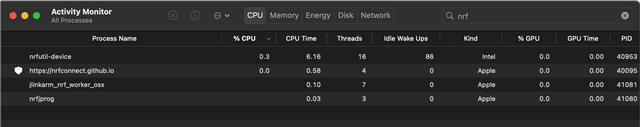
Here is a second screenshot of the 'nrf' named processes during a successful debug and flash. Notice: the other tools are Apple-silicon. I installed everything through the NRFConnect app using the automatic mode, so whatever is here is the default. (You can disregard the "https://..." line, that's a website I must be looking-at now).
Anyway, I'd like to know if there are any workarounds. I have a team of engineers using M1/M2 macs who will need to use the debug tools for the NRF91  . If there's anything I can do on my end, such as rebuilding nrfutil-device, just let me know.
Best regards,
JPN

