Hello,
I am starting with the nRF Connect. I got a nRF52840 DK and I am following the 'nRF Connect for VS Code' YT series.
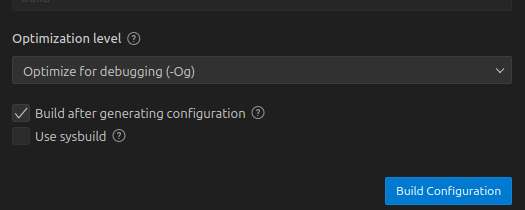
I got as far as part 5 (debugging), but I cannot get the Thread Viewer going. I can set breakpoints and inspect variables and memory but the Thread Viewer window remains empty. I made sure that the debug options are enabled in the build configuration. I also set 'CONFIG_DEBUG_THREAD_INFO=y' in prj.conf.
Some basic information:
- VS Code 1.81.1
- nRF Connect 2.4.0
- Win10
The nRF Connect is a clean installation. VS Code, however, is an older install as I am using it with an nRF SDK project.
Any idea what could be wrong here?
Thanks,
Norbert