HI Team,
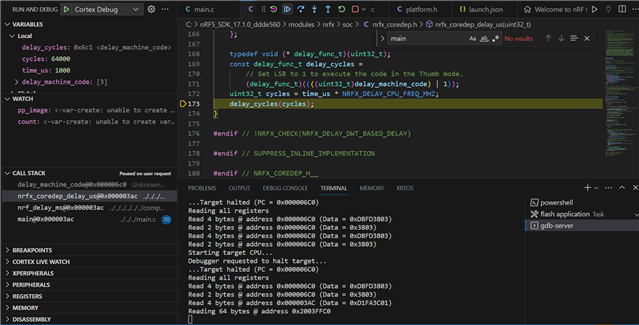
I am facing trouble debugging the code in visual studio Code. Whenever I try to step over the code , it starts from delay cycles function in nrfx_cordep.h file. Attaching the screenshot for reference.
Launch.json file for debugging
{
// Use IntelliSense to learn about possible attributes.
// Hover to view descriptions of existing attributes.
// For more information, visit: go.microsoft.com/.../
"version": "0.2.0",
"configurations": [
{
"name": "Cortex Debug",
"cwd": "${workspaceRoot}",
"executable": "C:/nRF5_SDK_17.1.0_ddde560/examples/peripheral/blinky/pca10056/blank/armgcc/_build/nrf52840_xxaa.out",
"request": "launch",
"type": "cortex-debug",
"servertype": "jlink",
"device": "nrf52",
"interface": "swd",
"preLaunchTask": "flash application",
"serverpath": "C:/Program Files/SEGGER/JLink/JLinkGDBServerCL.exe",
"armToolchainPath": "C:/Program Files (x86)/GNU Arm Embedded Toolchain/10 2021.10/bin",
"svdFile": "../../../modules/nrfx/mdk/nrf52.svd",
"rttConfig": {
"enabled": true,
"address": "auto",
"decoders": [
{
"port": 0,
"type": "console",
}
]
}
}
]
}

I am not able to figure out, why the program always start from this point and I want to know how to see the memory configuration while debugging?
Thanks in advance


