Peripheral Register view broken in VS Code

This morning, the peripheral registers view stopped working in VS Code. This is part of the Cortex-Debug extension used when debugging through the nRF Connect extension. The Cortex-Debug extension seems to be attempting to parse a JSON svd file that is installed as part of the nRF Connect extension. I don't know why this error suddenly started happening. Debug sessions were working fine yesterday. Restarting VS Code does not help. Uninstalling, deleting the nRF Connect extension's install folders off the disk, and reinstalling nRF Connect extension does not help. This is connecting to a nRF5340 DK. The debug session is working and I can step through the code.

Here is output from the console of the Developer Tools:

console.ts:137 [Extension Host] Error: Non-whitespace before first tag.
Line: 0
Column: 1
Char: {
    at error (c:\Users\AFont\.vscode\extensions\mcu-debug.peripheral-viewer-1.4.6\dist\desktop\extension.js:1526:10)
    at strictFail (c:\Users\AFont\.vscode\extensions\mcu-debug.peripheral-viewer-1.4.6\dist\desktop\extension.js:1552:7)
    at beginWhiteSpace (c:\Users\AFont\.vscode\extensions\mcu-debug.peripheral-viewer-1.4.6\dist\desktop\extension.js:1826:7)
    at SAXParser.write (c:\Users\AFont\.vscode\extensions\mcu-debug.peripheral-viewer-1.4.6\dist\desktop\extension.js:1881:11)
    at __webpack_modules__../node_modules/xml2js/lib/parser.js.exports.Parser.Parser.parseString (c:\Users\AFont\.vscode\extensions\mcu-debug.peripheral-viewer-1.4.6\dist\desktop\extension.js:8482:31)
    at Parser.parseString (c:\Users\AFont\.vscode\extensions\mcu-debug.peripheral-viewer-1.4.6\dist\desktop\extension.js:8164:59)
    at c:\Users\AFont\.vscode\extensions\mcu-debug.peripheral-viewer-1.4.6\dist\desktop\extension.js:8497:24
    at new Promise (<anonymous>)
    at __webpack_modules__../node_modules/xml2js/lib/parser.js.exports.Parser.Parser.parseStringPromise (c:\Users\AFont\.vscode\extensions\mcu-debug.peripheral-viewer-1.4.6\dist\desktop\extension.js:8495:14)
    at Parser.parseStringPromise (c:\Users\AFont\.vscode\extensions\mcu-debug.peripheral-viewer-1.4.6\dist\desktop\extension.js:8164:59)
    at __webpack_modules__../node_modules/xml2js/lib/parser.js.exports.parseStringPromise (c:\Users\AFont\.vscode\extensions\mcu-debug.peripheral-viewer-1.4.6\dist\desktop\extension.js:8537:19)
    at PeripheralTreeForSession.<anonymous> (c:\Users\AFont\.vscode\extensions\mcu-debug.peripheral-viewer-1.4.6\dist\desktop\extension.js:5585:69)
    at Generator.next (<anonymous>)
    at fulfilled (c:\Users\AFont\.vscode\extensions\mcu-debug.peripheral-viewer-1.4.6\dist\desktop\extension.js:5453:58)
w @ console.ts:137

The file in question is:

C:\Users\AFont\.vscode\extensions\nordic-semiconductor.nrf-connect-2023.11.301-win32-x64\svd\nrf5340_application.json

Please help me understand what went wrong and how I can get it corrected.

Parents
  • Hi,

    I'm not sure what changed since the cortex-debug extension stopped working, but is it an option to use our recommended nRF Debug extension instead (https://nrfconnect.github.io/vscode-nrf-connect/release_notes/connect/2022.9.179.html?h=cortex+debug#new-default-debugger-nrf-debug)?

    Best regards,

    Vidar

  • Hi Vidar,

    Thank you for pointing this out. I was not aware of the different backend. I think my setup was using the nRF Debug backend already. I checked for the nrf-connect.debugger.backend setting described in the article, but it seems to no longer exist? I am on version 2023.11.301 of the nRF Connect extension and that article is written for 2022.9.179. When I attempt to add nrf-connect.debugger.backend into the settings.json directly, the IntelliSense says "Unknown Configuration Setting".

    Anyway, I went with the assumption that the nRF Debug backend is the one actually being used. This means I might have the wrong peripheral registers view open. Sure enough, I was able to open the correct view using the command palette and this one works properly.

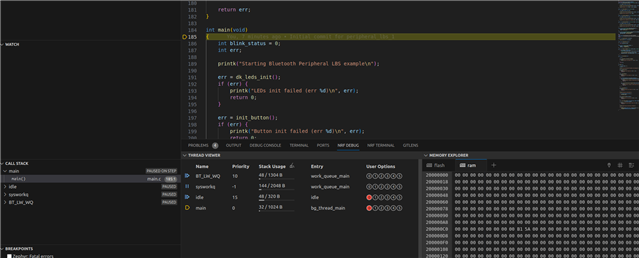
    I do have a different issue now, though. I am not seeing any of the threads in the Thread Viewer or the Call Stack window. Normally (and maybe this was a Cortex Debug thing), the Call Stack view shows the call stacks for all threads. Now it shows only the active call stack. The Thread Viewer view is empty and says "No threads are available to display" even though I'm halted in a thread created using K_THREAD_DEFINE.

Reply
  • Hi Vidar,

    Thank you for pointing this out. I was not aware of the different backend. I think my setup was using the nRF Debug backend already. I checked for the nrf-connect.debugger.backend setting described in the article, but it seems to no longer exist? I am on version 2023.11.301 of the nRF Connect extension and that article is written for 2022.9.179. When I attempt to add nrf-connect.debugger.backend into the settings.json directly, the IntelliSense says "Unknown Configuration Setting".

    Anyway, I went with the assumption that the nRF Debug backend is the one actually being used. This means I might have the wrong peripheral registers view open. Sure enough, I was able to open the correct view using the command palette and this one works properly.

    I do have a different issue now, though. I am not seeing any of the threads in the Thread Viewer or the Call Stack window. Normally (and maybe this was a Cortex Debug thing), the Call Stack view shows the call stacks for all threads. Now it shows only the active call stack. The Thread Viewer view is empty and says "No threads are available to display" even though I'm halted in a thread created using K_THREAD_DEFINE.

Children
Related