
hello Nordic
i am working with nrf52840 and nrf52832, with ncs v2.3.0 (and i am moving to ncs v2.5.0)
i am trying to compare the memory report of my app with ncs 2.3.0 vs my app with ncs 2.5.0 to find source of some diff i have
1. how can i save the memory report so i can have both of the report opened on different windows for easy compare
(i know there is a ram.json file but it is less comfortable then the GUI) ?
2. when building i see a diff in total ram take between the gui and the actual build as can be seen in the added pic
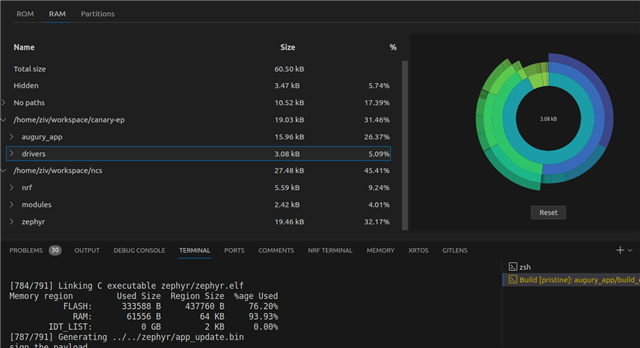
any idea why ?
hope to read from you soon
best regards
Ziv

