
Hello,
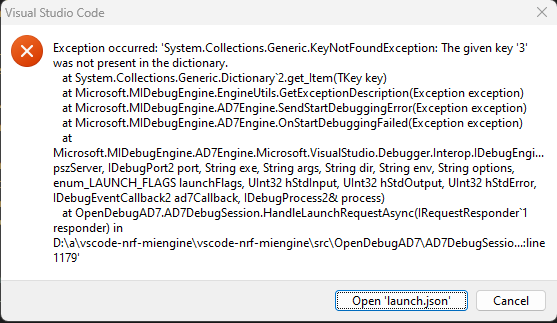
I have been able to successfully use the debugger in nRF Connect for VS Code for the nRF 5340DK. But now I am using a custom board (with a 5340 SOC) and when I try to launch the debugger the same way as with the DK, I am shown the following VS Code error.
This is what is in the launch.json file, I have two builds, one being "optimised for debugging".
{
	"version": "0.2.0",
	"configurations": [
		{
			"type": "nrf-connect",
			"request": "launch",
			"name": "Launch build_debug",
			"config": "${workspaceFolder}/build_debug",
			"runToEntryPoint": "main",
			"logging": {
				"programOutput": true,
				"engineLogging": true,
				"trace": false,
				"traceResponse": false
			}
		},
		{
			"type": "nrf-connect",
			"request": "launch",
			"name": "Launch build",
			"config": "${workspaceFolder}/build",
			"runToEntryPoint": "main"
		}
	]
}
The debug console outputs the following error, but I can't find any reference to what a code 42 might relate to.
The program 'c:/_Workspace/Folder/SubFolder/build/zephyr/zephyr.elf' has exited with code 42 (0x0000002a).
Posting publicly here in case anyone else has had a similar issue and been able to resolve it, my Googling hasn't got me very far in trying to fix the debugger.
Thanks

