Hello!
Some intro: I recently had to switch laptops because mine had some HW issues and needed to be sent back to warranty. On the first laptop debugger in VS Code worked just fine and I could debug applications without any issues.
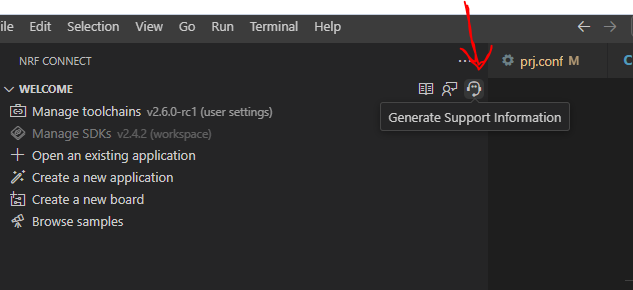
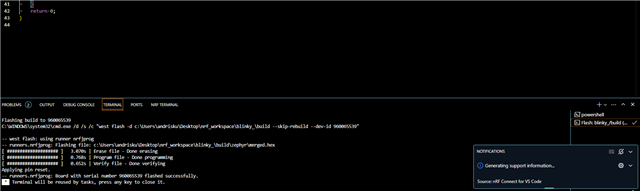
Now on the new laptop I re-installed everything like before following https://developer.nordicsemi.com/nRF_Connect_SDK/doc/latest/nrf/installation/install_ncs.html# this instruction but I upgraded SDK version from 2.5.0 to 2.5.2. Now when I try to launch the nRF Connect debugger it just flashes the nRF9160 dk and does nothing else. In other words the Debug option does exactly the same what the Flash option does. Since I did not want to bother with it in the beginning I just downloaded Ozone and used it, but I'd prefer to use the builtin nRF Connect connect debugger. Did not find any useful workarounds since most of the people that have some debugger issues at least manage to launch the debugging session but my system does not get that far. I checked nRF Connect settings in VS Code and did not find anything about debugger path (for example to use gdb) or anything like that. I haven't tried to downgrade the SDK bersion back to 2.5.0 because I believe that it is not the issue here (maybe will try next week if I have some spare time).
I'm probably missing something simple, but I can't find the root cause of this. I would appreciate any help to be able to use debugger within VS code.
I am working on Windows 10 22H2, VS Code 1.87.1, SDK and Toolchan version 2.5.2.
Thanks in advance,
Andris