10% failure rate of individual DM subsystem ranging calculations

Summary
I'm finding the DM subsystem's individual ranging calculations fail around 10% of the time (in line-of-sight conditions, around one meter apart). Is this expected?
 

Test Setup
I have two nRF5340's running a (slightly) modified version of the "nrf_dm" sample with all of the default Kconfig options and Bluetooth scan/advertising settings, except for the following:

CONFIG_DM_TIMESLOT_QUEUE_COUNT_SAME_PEER=1
CONFIG_LOG_MODE_DEFERRED=y
 

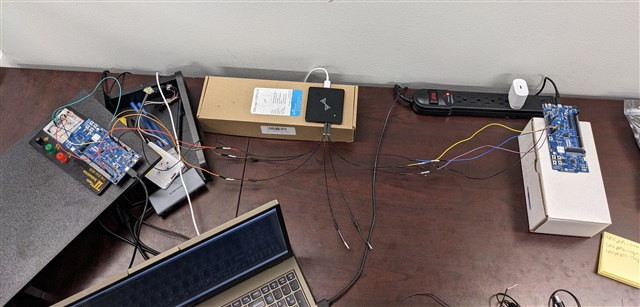
  • I'm doing one-directional ranging and using MAC address filters to know when to start ranging.
  • Environment is a typical office space with 10-20 nearby laptops and a couple of Wi-Fi routers
  • The nRF5340 on the left is the "reflector" and is only advertising.
  • The nRF5340 on the right is the "initiator" and is only scanning.
  • Most importantly: The application logic ensures only one ranging calculation happens every 3 seconds:
    • the "reflector" turns on advertising (timeout = 1000ms) and starts a 3 second timer
    • the "reflector" stops advertising after the first call to dm_request_add()
    • when the timer expires, the "reflector" starts advertising again and the process repeats
       
Test Results
I get slightly different results depending on which device's log output I analyze. You can see from the data below that I tracked the failure types to help isolate ranging failures and ignore synchronization failures (e.g. "reflector" advertisement was never scanned by the "initiator").
 
From the "initiator" perspective:
Total Failures: 111
  Ranging Failures: 58    i.e. data_ready() never called
  CRC Failures: 15        i.e. Quality == "crc fail"
  Scanning Failures: 38   i.e. scan_filter_match()/data_cb() never called
Ranging Requests: 699     i.e. dm_request_add() was called
Ranging Successes: 626    i.e. Quality == "ok"
 
Looking at just (Ranging Failures) / (Ranging Requests): 8.3% failure rate
Looking at (Ranging Failures + CRC Failures) / (Ranging Requests): 10.4% failure rate
 
From the "reflector" perspective:
Total Failures: 110
  Ranging Failures: 74    i.e. data_ready() never called
  CRC Failures: 11        i.e. Quality == "crc fail"
  Scanning Failures: 25   i.e. adv_scanned_cb() never called
Ranging Requests: 712     i.e. dm_request_add() was called
Ranging Successes: 627    i.e. Quality == "ok"
 
Looking at just (Ranging Failures) / (Ranging Requests): 10.4% failure rate
Looking at (Ranging Failures + CRC Failures) / (Ranging Requests): 11.9% failure rate
  
 
Logic Analyzer
I'm seeing two main types of "ranging" failures in the logic analyzer. Note that I added a "success" GPIO that is toggled when the data_ready() callback indicates a ranging event completed. 
 
Success
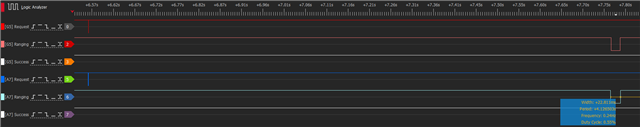
For comparison purposes, you can see both "reflector" (blue) and "initiator" (red) get the dm request, start ranging, and get a result.
 
Failure Mode #1 - Short Ranging Window
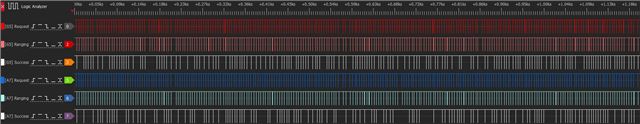
The time spent "ranging" on both the "reflector" (blue) and "initiator" (red) is truncated in this failure mode. You can see the ranging window is within a few milliseconds, and neither device gets results.
 
Failure Mode #2 - Long Ranging Window
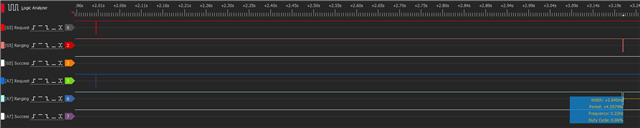
The time spent "ranging" on both the "reflector" (blue) and "initiator" (red) is NOT truncated in this failure mode. You can see the ranging window is within a few dozen milliseconds, and neither device gets results.
 
Parents
  • Hi,

    Some of the issues that you see are in the synchronization (BLE) stage. Successful synchronization requires the devices to make contact (advertising advertising at the same time as the scanner is scanning) and successfully transfer three packets (advertisement, scan request, and scan response.)

    The nrf_dm sample uses the following default settings:

    Scanner (static struct bt_le_scan_param scan_param):
    Scan interval: 60 ms. (BT_GAP_SCAN_FAST_INTERVAL, value of 0x60, unit is 0.625 ms.)
    Scan window: 30 ms. (BT_GAP_SCAN_FAST_WINDOW, value of 0x30, unit is 0.625 ms.)

    This provides a scan duty cycle of 50 %. Increasing the window, e.g. to 60 ms (same as the interval) would give 100 % scan dyty cycle, which should significantly increase reception of advertising packets.

    Advertiser (struct bt_le_adv_param adv_param_nonconn):
    Minimum advertising interval: 100 ms. (BT_GAP_ADV_FAST_INT_MIN_2, value of 0xA0, unit is 0.625 ms.)
    Maximum advertising interval: 150 ms. (BT_GAP_ADV_FAST_INT_MAX_2, value of 0xF0, unit is 0.625 ms.)

    A lower advertising interval (e.g. BT_GAP_ADV_FAST_INT_MIN_1 and corresponding ..MAX..) leads to more advertisements sent within the timeout, which should increase the chance of getting through to the scanner.

    Increasing scan duty cycle and advertising frequency should be fine, given that the devices do not both advertise and scan. (If they use both roles, then duty cycle / advertising interval needs to be relaxed enough that there is enough time for scheduling both activities, hence the settings used in the sample. With only one role used for each device, it should be safe to increase the settings for that role.)

    You could also consider increasing the advertising timeout value, for providing more time for synchronization. However depending on the time required for the ranging, this could increase the risk of ranging not getting finished before the next synchronization starts, resulting in more ranging failures.

    Regards,
    Terje

  • Thanks Terje, this is helpful for the "synchronization" failures like you said. 

    However, my purpose making this ticket was to discuss the "ranging" failures I'm seeing. I described how I isolated the failure types, and my percent failure calculations (plus logic analyzer samples) demonstrate failures purely in the "ranging" stage (i.e. both devices have synchronized and submitted a dm_request_add(), ranging was performed, but results weren't received or the quality was 'crc failure').

    Because ranging events are so power-consuming, a failure rate as high as 10% becomes quite significant! Especially considering the tests I performed were in such low-stress scenarios (i.e. one isolated ranging event at a time between one pair of devices).

    Should we expect individual "ranging" events to fail this much? Are there ways to improve the success rates of individual "ranging" events?

  • Hi,

    What intrigues me the most is the type where data_ready() never gets called. In general I would expect the two to three seconds to be more than enough, from ranging starts until initializing the next synchronization. I have reached out internally to see if there are any known issues and/or what the expectation should be, and I hope to have some answers regarding this tomorrow.

    Logs from the devices could reveal more details, regarding where and when the ranging fails, so that might be useful for further analysis.

    Regards,
    Terje

  • Here you go. In the zip file are my two projects "initiator" and "reflector" as well as log files and a log processing bash script.

    04-09-24_hadm-ranging-failures.zip

    04-09-24_hadm-ranging-failures$ ./proc.sh log_reflector.txt log_initiator.txt
    
    initiator_failure_scan: 32
    initiator_failure_range: 96
    initiator_failure_crc: 23
    initiator_success: 807
    initiator_requests: 926
    
    reflector_failure_scan: 25
    reflector_failure_range: 110
    reflector_failure_crc: 16
    reflector_success: 801
    reflector_requests: 927

    Also in the log file is a DSView log capture of 20 minutes of the above projects. You must use nRF5340's for both ends, because both projects depend on device tree overlays for a new GPIO p0.06 that is toggled when ranging results are ready.

    Here's a screenshot, but you can also download DSView and open the capture file

    note: initiator == G5, reflector == A7


    Thanks for your help!

  • Hi,

    Doing a short test on my desk, I have a significantly better success rate:

    Your test My test
    initiator
    failure_scan 32 3.46 % 64 14.68 %
    failure_range 96 10.37 % 3 0.69 %
    failure_crc 23 2.48 % 2 0.46 %
    success 807 87.15 % 431 98.85 %
    requests 926 100.00 % 436 100.00 %
    reflector
    failure_scan 25 2.70 % 0 0.00 %
    failure_range 110 11.87 % 5 1.44 %
    failure_crc 16 1.73 % 5 1.44 %
    success 801 86.41 % 338 97.13 %
    requests 927 100.00 % 348 100.00 %

    Please disregard my initiator_failure_scan number as that seems to mostly stem from my initator log starting at sequence 63. The real number is therefore 0 or 1.

    My numbers for range and crc failures are both low (ballpark number around one percent, but a much longer test is needed for accurate numbers with so few occurences.) They also seem to be of similar size (but again small numbers mean this could be by chance.) From your logs I see you experience range failures of higher than 10 %, and range failures are 4-7 times as frequent as crc failures.

    Since the range failures are missing data_ready(), they may stem from the following lines in dm.c:

                                    } else {
                                            LOG_DBG("Ranging failed (nrf_dm status: %d)",
                                                                              dm_context.nrf_dm_status);
                                    }

    You should then get a log message printing a status code describing the type of error:

    typedef enum {
            NRF_DM_STATUS_SUCCESS = 0,
            NRF_DM_STATUS_FAIL_SYNC = 1,
            NRF_DM_STATUS_EVENT_FAIL_TIMEOUT = 2,
            NRF_DM_STATUS_CONF_INVALID = 3
    } nrf_dm_status_t;

    (https://github.com/nrfconnect/sdk-nrfxlib/blob/39c4313f419d49a2f4d7fd14ad34da2b7ed8888e/nrf_dm/include/nrf_dm.h#L61C1-L66C19)

    In order to investigate further, it would be great to know which of these (if any) are responsible for the failures. For that, you must enable logging on the debug level for the distance measurement module, and provide the log (or aggregated count after processing the log.)

    Regards,
    Terje

  • Unfortunately, I've moved on to other tasks so I can't spend time looking into this any more. However, your 1% failure rate is quite surprising to me, considering I repeated this test at my house and saw failure rates closer to 5%

    Here's my results from that test (which I ran overnight), although unfortunately I don't have any logs like you're asking - just the statistics below. 

    initiator_failure: 634
    initiator_failure_range: 476
    initiator_failure_crc: 61
    initiator_failure_scan: 97
    initiator_success: 9449
    initiator_request: 9986
    initiator_total: 10083

    Looking at just (Ranging Failures) / (Ranging Requests): 4.7% failure rate
    Looking at (Ranging Failures + CRC Failures) / (Ranging Requests): 5.4% failure rate

    reflector_failure: 967
    reflector_failure_range: 736
    reflector_failure_crc: 226
    reflector_failure_scan: 5
    reflector_success: 9116
    reflector_request: 10078
    reflector_total: 10083

    Looking at just (Ranging Failures) / (Ranging Requests): 7.3% failure rate
    Looking at (Ranging Failures + CRC Failures) / (Ranging Requests): 9.5% failure rate

    Thanks for your help,

    Cal

  • Hi,

    I see that you still have a lot of range failures, but also crc and scan.

    I am not quite able to read the version numbers and production date from the stickers on the boards. What are they, for the two boards? I can potentially check against known issues with SoC and/or DK versions.

    I see on the photograph of your setup, that one DK rests on top of a breadboard. Antennas are affected by conductive material in their near field. It may be as simple as the copper in the breadboard changing the electrical surroundings of the antenna enough to affect RF performance. The antenna is at the edge of the DK, under the Nordic Semiconductor logo and text. Rotating the DK by 90 degrees, so that the antenna end sticks out by at least 1-2 cm (half an inch or so) from the breadboard below, should be enough to eliminate that potential error source.

    I am afraid for further debugging you should either get better logs or do a debug session. Figuring out where exactly it fails is key to understanding why you see the bad performance, and consequently to solve it.

    A BLE sniffer trace could also provide some information, but that would be for the BLE part only. (E.g. show timing of advertising, scan request and scan response, as well as CRC failures for those as seen by the sniffer.)

    Regards,
    Terje

Reply
  • Hi,

    I see that you still have a lot of range failures, but also crc and scan.

    I am not quite able to read the version numbers and production date from the stickers on the boards. What are they, for the two boards? I can potentially check against known issues with SoC and/or DK versions.

    I see on the photograph of your setup, that one DK rests on top of a breadboard. Antennas are affected by conductive material in their near field. It may be as simple as the copper in the breadboard changing the electrical surroundings of the antenna enough to affect RF performance. The antenna is at the edge of the DK, under the Nordic Semiconductor logo and text. Rotating the DK by 90 degrees, so that the antenna end sticks out by at least 1-2 cm (half an inch or so) from the breadboard below, should be enough to eliminate that potential error source.

    I am afraid for further debugging you should either get better logs or do a debug session. Figuring out where exactly it fails is key to understanding why you see the bad performance, and consequently to solve it.

    A BLE sniffer trace could also provide some information, but that would be for the BLE part only. (E.g. show timing of advertising, scan request and scan response, as well as CRC failures for those as seen by the sniffer.)

    Regards,
    Terje

Children
No Data
Related