Request
I need help debugging to figure out why I'm getting the infamous ZEPHYR FATAL ERROR 4: Kernel panic on CPU 0Any ideas on what I should investigate next would be greatly appreciated. I'm currently stuck and my deadline is approaching quickly. My leading theory is that it may be a deadlock from callingbt_gatt_write_without_response() while ATT request queue is full, but I don't know how to confirm that or rule it out.
Problem Statement
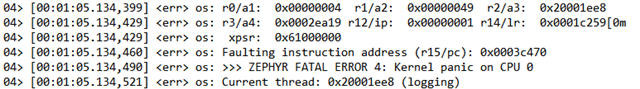
This weekend I ran a test where I was sending the same 574 byte packet every 1.5 seconds over USB CDC to the nRF52840DK's USB device port (i.e. on long side of DK). And my firmware application reset 51 times due to a ZEPHYR FATAL ERROR 4: Kernel panic on CPU 0 in 9 hours and 34 minutes. The time between resets varied randomly between 4 seconds to 92 minutes with an average of 10.6 minutes.
Log(s)
Attached is my RTT log with the Auto Thread Analyzer set to report every 5 seconds and HEAP usage statistics. From my analysis, it doesn't seem to be a heap or stack size issue.
4846.2024-04-20 11.14 Debugging Dongle Reset w Thread Analyzer.log
Firmware App Info
My firmware application started from the Multi-NUS application. This is a Long Range Bluetooth LE USB Dongle application that needs to receive a ~600 byte packet every 1 second from the USB Host (over USB CDC) and send the packet to 3 concurrently connected peripherals over the Coded PHY while asynchronously receiving a 53 byte packet from each of the connected peripherals every 500 ms and send them over USB CDC to the USB Host.
Using the Muti-NUS application as my starting point, I have made the following modifications:
- Upgraded Multi-NUS from NCS v1.4.1 to NCS v2.5.0 with help from Wes ... Thanks Wes!
- Added USB CDC support using the Peripheral UART sample as a guide
- Changed scanning and connecting to only use the Coded PHY (I.E. scans on Coded PHY only for new connections that support the NUS LE service) using the Bluetooth: Central Heart Rate Monitor with Coded PHY as a guide.
- Extended
nus_client.cto support sending data to the RX characteristic of the NUS server by callingbt_gatt_write_without_response()instead ofbt_gatt_write()by adding the following new function.int bt_nus_client_send_without_response(struct bt_nus_client *nus_c, const uint8_t *data, uint16_t len) { int err; LOG_DBG("Sending data without response"); if (!nus_c->conn) { return -ENOTCONN; } if (atomic_test_and_set_bit(&nus_c->state, NUS_C_RX_WRITE_PENDING)) { return -EALREADY; } nus_c->rx_write_params.func = on_sent; nus_c->rx_write_params.handle = nus_c->handles.rx; nus_c->rx_write_params.offset = 0; nus_c->rx_write_params.data = data; nus_c->rx_write_params.length = len; err = bt_gatt_write_without_response(nus_c->conn, nus_c->handles.rx, data, len, false); if (err) { LOG_ERR("Write without response failed (err %d)", err); } on_sent(nus_c->conn, err, &nus_c->rx_write_params); return err; } - Increased the
BT_NUS_UART_BUFFER_SIZEin theKconfigfile to 1034 - Modified
multi_nus_send()to broadcast up to MTU size chunks for when incoming USB packets are greater than the MTU size (currently 189, but I'm still tuning). - More than doubled all stack and heap sizes I could find in
prj.conffile andKconfigfile - Added reporting of HEAP runtime stats using
sys_heap_runtime_stats_get() - Enabled & configured the Thread Analyzer module (auto report interval set to minimum value ... 5 seconds)
Project Upload