Memory allocation

Hi

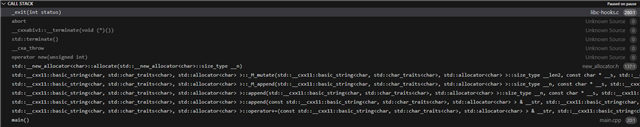
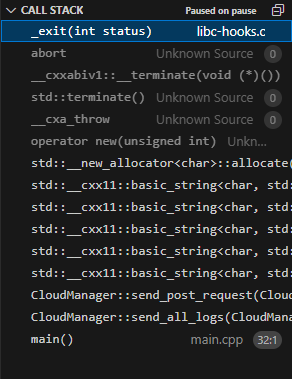
I'm trying to figure out how to manage my memory on the nrf9160 sip. Currently my application crashes on a specific lines where I try to allocate a large C++ string (the crash happens at around a string size of 10 kB see call stack below).  

I've tried playing around with the config file and use different sizes, but nothing seems to help.

# Heap and stacks
CONFIG_HEAP_MEM_POOL_SIZE=32000
CONFIG_MAIN_STACK_SIZE=32000
CONFIG_SYSTEM_WORKQUEUE_STACK_SIZE=32000

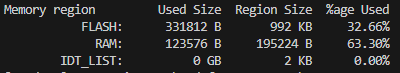
I can see when I'm building my application I get this memory report, which also indicates that I lots of unused memory:

I also found the thread analyzer function to print out the stack usage of all threads, which reports runtime that there is lots of memory left:

[00:04:20.621,856] <inf> thread_analyzer: Thread analyze:
[00:04:20.622,406] <inf> thread_analyzer:  0x20011310          : STACK: unused 496 usage 272 / 768 (35 %); CPU: 0 %
[00:04:20.623,046] <inf> thread_analyzer:       : Total CPU cycles used: 51217
[00:04:20.623,718] <inf> thread_analyzer:  0x200113b8          : STACK: unused 848 usage 176 / 1024 (17 %); CPU: 0 %
[00:04:20.624,389] <inf> thread_analyzer:       : Total CPU cycles used: 1
[00:04:20.628,845] <inf> thread_analyzer:  0x20011660          : STACK: unused 31368 usage 752 / 32120 (2 %); CPU: 0 %
[00:04:20.629,547] <inf> thread_analyzer:       : Total CPU cycles used: 1188
[00:04:20.630,126] <inf> thread_analyzer:  0x200114b0          : STACK: unused 236 usage 84 / 320 (26 %); CPU: 58 %
[00:04:20.630,767] <inf> thread_analyzer:       : Total CPU cycles used: 4950365
[00:04:20.634,155] <inf> thread_analyzer:  0x20011558          : STACK: unused 22480 usage 9640 / 32120 (30 %); CPU: 41 %
[00:04:20.634,857] <inf> thread_analyzer:       : Total CPU cycles used: 3513906
[00:04:20.635,559] <inf> thread_analyzer:  ISR0                : STACK: unused 1672 usage 376 / 2048 (18 %)

I do not use dynamic allocation (or atleast not that I'm aware of) so the heap should be unsed.

Is this a memory issue? And is there any way to get more information about my memory usage runtime?

Parents
  • Hello,

    Could you please share the string allocation part from your code? 

    Thanks.

    BR
    Kazi 

  • I've made this small test sample: 

    int main(void)
    {	
    	std::string test;
    
    	thread_analyzer_print();
    
    	for(int i = 0; i < 10000; i++)
    	{
    		test += std::to_string(i);
    
    		if(i % 1000 == 0)
    			thread_analyzer_print();
    
    		k_sleep(K_MSEC(10));
    	}
    
    	return 0;
    }

    The memory prints doesn't show a increase in usage when I concatenate to the string. If it is not allocated on the main stack, then where is it allocated? 

    [00:00:00.380,676] <inf> thread_analyzer: Thread analyze:
    [00:00:00.387,268] <inf> thread_analyzer:  mqtt_helper_thread  : STACK: unused 2528 usage 32 / 2560 (1 %); CPU: 0 %
    [00:00:00.398,925] <inf> thread_analyzer:       : Total CPU cycles used: 0
    [00:00:00.406,951] <inf> thread_analyzer:  0x2000d308          : STACK: unused 992 usage 32 / 1024 (3 %); CPU: 0 %
    [00:00:00.418,487] <inf> thread_analyzer:       : Total CPU cycles used: 0
    [00:00:00.427,337] <inf> thread_analyzer:  sysworkq            : STACK: unused 7800 usage 200 / 8000 (2 %); CPU: 0 %
    [00:00:00.439,056] <inf> thread_analyzer:       : Total CPU cycles used: 0
    [00:00:00.446,960] <inf> thread_analyzer:  idle                : STACK: unused 288 usage 32 / 320 (10 %); CPU: 0 %
    [00:00:00.458,496] <inf> thread_analyzer:       : Total CPU cycles used: 0
    [00:00:00.482,208] <inf> thread_analyzer:  main                : STACK: unused 124592 usage 944 / 125536 (0 %); CPU: 100 %
    [00:00:00.494,506] <inf> thread_analyzer:       : Total CPU cycles used: 3519
    [00:00:00.502,838] <inf> thread_analyzer:  ISR0                : STACK: unused 1624 usage 424 / 2048 (20 %)
    [00:00:00.513,732] <inf> thread_analyzer: Thread analyze:
    [00:00:00.520,324] <inf> thread_analyzer:  mqtt_helper_thread  : STACK: unused 2528 usage 32 / 2560 (1 %); CPU: 0 %
    [00:00:00.531,982] <inf> thread_analyzer:       : Total CPU cycles used: 0
    [00:00:00.540,008] <inf> thread_analyzer:  0x2000d308          : STACK: unused 992 usage 32 / 1024 (3 %); CPU: 0 %
    [00:00:00.551,544] <inf> thread_analyzer:       : Total CPU cycles used: 0
    [00:00:00.560,363] <inf> thread_analyzer:  sysworkq            : STACK: unused 7800 usage 200 / 8000 (2 %); CPU: 0 %
    [00:00:00.572,113] <inf> thread_analyzer:       : Total CPU cycles used: 0
    [00:00:00.579,986] <inf> thread_analyzer:  idle                : STACK: unused 288 usage 32 / 320 (10 %); CPU: 0 %
    [00:00:00.591,552] <inf> thread_analyzer:       : Total CPU cycles used: 0
    [00:00:00.615,295] <inf> thread_analyzer:  main                : STACK: unused 124592 usage 944 / 125536 (0 %); CPU: 100 %
    [00:00:00.627,563] <inf> thread_analyzer:       : Total CPU cycles used: 7880
    [00:00:00.635,894] <inf> thread_analyzer:  ISR0                : STACK: unused 1624 usage 424 / 2048 (20 %)
    [00:00:10.748,352] <inf> thread_analyzer: Thread analyze:
    [00:00:10.754,943] <inf> thread_analyzer:  mqtt_helper_thread  : STACK: unused 2368 usage 192 / 2560 (7 %); CPU: 0 %
    [00:00:10.766,662] <inf> thread_analyzer:       : Total CPU cycles used: 1
    [00:00:10.774,658] <inf> thread_analyzer:  0x2000d308          : STACK: unused 824 usage 200 / 1024 (19 %); CPU: 0 %
    [00:00:10.786,407] <inf> thread_analyzer:       : Total CPU cycles used: 1
    [00:00:10.795,257] <inf> thread_analyzer:  sysworkq            : STACK: unused 7800 usage 200 / 8000 (2 %); CPU: 0 %
    [00:00:10.807,006] <inf> thread_analyzer:       : Total CPU cycles used: 0
    [00:00:10.814,880] <inf> thread_analyzer:  idle                : STACK: unused 236 usage 84 / 320 (26 %); CPU: 96 %
    [00:00:10.826,538] <inf> thread_analyzer:       : Total CPU cycles used: 329007
    [00:00:10.850,738] <inf> thread_analyzer:  main                : STACK: unused 124592 usage 944 / 125536 (0 %); CPU: 3 %
    [00:00:10.862,884] <inf> thread_analyzer:       : Total CPU cycles used: 13279
    [00:00:10.871,276] <inf> thread_analyzer:  ISR0                : STACK: unused 1624 usage 424 / 2048 (20 %)
    [00:00:20.983,581] <inf> thread_analyzer: Thread analyze:
    [00:00:20.990,173] <inf> thread_analyzer:  mqtt_helper_thread  : STACK: unused 2368 usage 192 / 2560 (7 %); CPU: 0 %
    [00:00:21.001,892] <inf> thread_analyzer:       : Total CPU cycles used: 1
    [00:00:21.009,887] <inf> thread_analyzer:  0x2000d308          : STACK: unused 824 usage 200 / 1024 (19 %); CPU: 0 %
    [00:00:21.021,636] <inf> thread_analyzer:       : Total CPU cycles used: 1
    [00:00:21.030,487] <inf> thread_analyzer:  sysworkq            : STACK: unused 7800 usage 200 / 8000 (2 %); CPU: 0 %
    [00:00:21.042,205] <inf> thread_analyzer:       : Total CPU cycles used: 0
    [00:00:21.050,109] <inf> thread_analyzer:  idle                : STACK: unused 236 usage 84 / 320 (26 %); CPU: 97 %
    [00:00:21.061,737] <inf> thread_analyzer:       : Total CPU cycles used: 658007
    [00:00:21.085,937] <inf> thread_analyzer:  main                : STACK: unused 124592 usage 944 / 125536 (0 %); CPU: 2 %
    [00:00:21.098,052] <inf> thread_analyzer:       : Total CPU cycles used: 18668
    [00:00:21.106,445] <inf> thread_analyzer:  ISR0                : STACK: unused 1624 usage 424 / 2048 (20 %)
    [00:00:31.218,780] <inf> thread_analyzer: Thread analyze:
    [00:00:31.225,372] <inf> thread_analyzer:  mqtt_helper_thread  : STACK: unused 2368 usage 192 / 2560 (7 %); CPU: 0 %
    [00:00:31.237,091] <inf> thread_analyzer:       : Total CPU cycles used: 1
    [00:00:31.245,086] <inf> thread_analyzer:  0x2000d308          : STACK: unused 824 usage 200 / 1024 (19 %); CPU: 0 %
    [00:00:31.256,835] <inf> thread_analyzer:       : Total CPU cycles used: 1
    [00:00:31.265,655] <inf> thread_analyzer:  sysworkq            : STACK: unused 7800 usage 200 / 8000 (2 %); CPU: 0 %
    [00:00:31.277,404] <inf> thread_analyzer:       : Total CPU cycles used: 0
    [00:00:31.285,278] <inf> thread_analyzer:  idle                : STACK: unused 236 usage 84 / 320 (26 %); CPU: 97 %
    [00:00:31.296,905] <inf> thread_analyzer:       : Total CPU cycles used: 987008
    [00:00:31.321,105] <inf> thread_analyzer:  main                : STACK: unused 124592 usage 944 / 125536 (0 %); CPU: 2 %
    [00:00:31.333,221] <inf> thread_analyzer:       : Total CPU cycles used: 24055
    [00:00:31.341,644] <inf> thread_analyzer:  ISR0                : STACK: unused 1624 usage 424 / 2048 (20 %)
    [00:00:41.453,887] <inf> thread_analyzer: Thread analyze:
    [00:00:41.460,479] <inf> thread_analyzer:  mqtt_helper_thread  : STACK: unused 2368 usage 192 / 2560 (7 %); CPU: 0 %
    [00:00:41.472,198] <inf> thread_analyzer:       : Total CPU cycles used: 1
    [00:00:41.480,224] <inf> thread_analyzer:  0x2000d308          : STACK: unused 824 usage 200 / 1024 (19 %); CPU: 0 %
    [00:00:41.491,943] <inf> thread_analyzer:       : Total CPU cycles used: 1
    [00:00:41.500,793] <inf> thread_analyzer:  sysworkq            : STACK: unused 7800 usage 200 / 8000 (2 %); CPU: 0 %
    [00:00:41.512,542] <inf> thread_analyzer:       : Total CPU cycles used: 0
    [00:00:41.520,416] <inf> thread_analyzer:  idle                : STACK: unused 236 usage 84 / 320 (26 %); CPU: 97 %
    [00:00:41.532,043] <inf> thread_analyzer:       : Total CPU cycles used: 1316009
    [00:00:41.556,335] <inf> thread_analyzer:  main                : STACK: unused 124592 usage 944 / 125536 (0 %); CPU: 2 %
    [00:00:41.568,450] <inf> thread_analyzer:       : Total CPU cycles used: 29443
    [00:00:41.576,873] <inf> thread_analyzer:  ISR0                : STACK: unused 1624 usage 424 / 2048 (20 %)

    After 5000 iterations the program crashes with the same stack trace. Still seems like an allocation problem.

  • NilsDR said:
    I'm using nRF version 2.4.0 and toolchain 2.4.0

    https://github.com/nrfconnect/sdk-zephyr/blob/v2.4.0-ncs-branch/samples/cpp_synchronization/prj.conf

    It should be available for NCS 2.4.0. Are you able to build the linked sample?

  • Hello Hakon,

    Yes, I'm able to build the linked sample, but it's using the CONFIG_MINIMAL_LIBC_MALLOC_ARENA_SIZE symbol and not the CONFIG_COMMON_LIBC_MALLOC_ARENA_SIZE symbol. This also requires MINIMAL_LIBC_MALLOC and  MINIMAL_LIBC to be set

  • Anyway, the default value for this is -1, meaning the rest of the RAM is used as malloc() space. Meaning the best you can achieve is by keeping the default value and not changing anything. I tested this, and changing CONFIG_COMMON_LIBC_MALLOC_ARENA_SIZE does affect the amount of space that can be allocated for std::string.

  • Okay, so since i'm not setting the CONFIG_COMMON_LIBC_MALLOC_ARENA_SIZE it must be -1 and then I already have the maximum amount of space for std::string? Im just curious to why i'm only able to allocate ~5000 bytes when the nrf9160 have 256kb ram. I must allocate the ram to something else?

    This is my current prj.conf

    # Cpp
    CONFIG_CPP=y
    CONFIG_STD_CPP20=y
    CONFIG_MINIMAL_LIBCPP=n
    CONFIG_CPP_MAIN=y
    CONFIG_GLIBCXX_LIBCPP=y
    CONFIG_CPP_EXCEPTIONS=y
    
    # Peripherals
    CONFIG_I2C=y
    CONFIG_UART_INTERRUPT_DRIVEN=y
    CONFIG_PWM=y
    
    # NEWLIB C
    CONFIG_NEWLIB_LIBC=y
    CONFIG_NEWLIB_LIBC_FLOAT_PRINTF=y
    
    # Network
    CONFIG_NETWORKING=y
    CONFIG_NET_NATIVE=n
    
    # LTE link control
    CONFIG_LTE_LINK_CONTROL=y
    CONFIG_LTE_NETWORK_MODE_LTE_M=y
    
    # Modem library
    CONFIG_NRF_MODEM_LIB=y
    
    # AT Host
    CONFIG_AT_HOST_LIBRARY=y
    
    # Azure IoT Hub library
    CONFIG_AZURE_IOT_HUB=y
    
    # Host name is set by DPS
    CONFIG_AZURE_IOT_HUB_HOSTNAME=""
    
    CONFIG_MQTT_HELPER_SEC_TAG=11
    CONFIG_MQTT_HELPER_SECONDARY_SEC_TAG=10
    
    # MQTT - Maximum MQTT keepalive timeout specified by Azure IoT Hub
    CONFIG_MQTT_KEEPALIVE=60
    
    # LED control
    CONFIG_DK_LIBRARY=y
    
    # Heap and stacks
    CONFIG_HEAP_MEM_POOL_SIZE=10000
    CONFIG_MAIN_STACK_SIZE=10000
    CONFIG_SYSTEM_WORKQUEUE_STACK_SIZE=8000
    
    # Settings, needed for Azure Device Provisioning Service
    CONFIG_FLASH=y
    CONFIG_FLASH_MAP=y
    CONFIG_FCB=y
    CONFIG_SETTINGS=y
    CONFIG_SETTINGS_FCB=y
    CONFIG_MPU_ALLOW_FLASH_WRITE=y
    CONFIG_AZURE_IOT_HUB_DPS=y
    
    # The ID scope can be omitted and provided at run time
    CONFIG_AZURE_IOT_HUB_DPS_ID_SCOPE="xxxxxxxxxx" 
    CONFIG_HW_ID_LIBRARY=y
    CONFIG_HWINFO=y
    
    CONFIG_NEWLIB_LIBC_NANO=n
    
    CONFIG_REBOOT=y
    
    # Watchdog
    CONFIG_WATCHDOG=y
    CONFIG_WDT_DISABLE_AT_BOOT=n
    
    #FOTA
    CONFIG_AZURE_FOTA=y
    CONFIG_AZURE_FOTA_APP_VERSION_AUTO=y
    CONFIG_AZURE_FOTA_TLS=y
    CONFIG_AZURE_FOTA_SEC_TAG=11
    CONFIG_FOTA_DOWNLOAD=y
    CONFIG_FOTA_DOWNLOAD_PROGRESS_EVT=y
    
    CONFIG_DOWNLOAD_CLIENT=y
    CONFIG_DOWNLOAD_CLIENT_HTTP_FRAG_SIZE_1024=y
    CONFIG_DOWNLOAD_CLIENT_STACK_SIZE=4096
    CONFIG_DOWNLOAD_CLIENT_BUF_SIZE=2300
    
    # DFU Target
    CONFIG_DFU_TARGET=y
    
    # Application update support
    CONFIG_BOOTLOADER_MCUBOOT=y
    
    # Image manager
    CONFIG_IMG_MANAGER=y
    CONFIG_STREAM_FLASH=y
    CONFIG_IMG_ERASE_PROGRESSIVELY=y

    I also use these to define some memory regions in my code, but that's only like ~5 kB combined memory:

    K_MSGQ_DEFINE(uart_msgq, 255, 10, 4), 

    K_THREAD_STACK_DEFINE(application_stack_area, KB(2));

    K_THREAD_STACK_DEFINE(threadStack, 512);
    I'm building it for the nrf9160dk_nrf9160_ns board.
    Can you see anything here that should reduce the available heap size for std::string?
  • I basically just want to increase the amount of RAM that std::string can allocate

Reply Children
No Data
Related