Non-halting debugging on nrf52840dk

I am following following procedure to use Non-halting debugging on nrf52840dk  with simple app.

https://developer.nordicsemi.com/nRF_Connect_SDK/doc/latest/nrf/test_and_optimize/debugging.html#enabling-non-halting-debugging-with-cortex-m-debug-monitor

Board used : nrf52840DK

SDK: nrfconnect 2.6.1

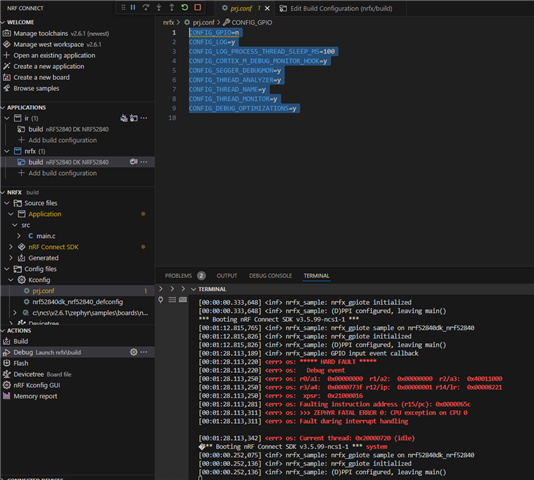
When the log point is hit following error is seen, Can you please check and help to resolve this

[00:00:00.251,800] <inf> nrfx_ir_sample: nrfx_gpiote sample on nrf52840dk_nrf52840
[00:00:00.251,922] <inf> nrfx_ir_sample: nrfx_gpiote initialized
[00:00:00.251,953] <inf> nrfx_ir_sample: Time to wait: 100 ms
[00:00:00.251,983] <inf> nrfx_ir_sample: Timer status: enable
[00:00:00.251,983] <inf> nrfx_ir_sample: (D)PPI configured, leaving main()
[00:00:03.020,874] <err> os: ***** HARD FAULT *****
[00:00:03.020,904] <err> os: Debug event
[00:00:03.020,935] <err> os: r0/a1: 0x00000000 r1/a2: 0x00000151 r2/a3: 0x4001a000
[00:00:03.020,935] <err> os: r3/a4: 0x00000044 r12/ip: 0x80000000 r14/lr: 0x00000dfb
[00:00:03.020,935] <err> os: xpsr: 0x01000016
[00:00:03.020,965] <err> os: Faulting instruction address (r15/pc): 0x00000dfc
[00:00:03.020,996] <err> os: >>> ZEPHYR FATAL ERROR 0: CPU exception on CPU 0
[00:00:03.020,996] <err> os: Fault during interrupt handling

[00:00:03.021,057] <err> os: Current thread: 0x20000810 (idle)

Thanks,

Mahesh

  • Hi Mahesh

    Due to some sickness internally and a bank holiday in Norway on Wednesday May 1st, we will need to get back to you on Thursday for some proper feedback on this case. Thank you for your patience. In the meantime, can you share some details on what exactly this "simple app" is doing and what drivers/libraries it is using?

    Best regards,

    Simon

  • Hi Mahesh,

    It is important to understand the context of the hardfault to have a proper debugging direction.

    As mentioned in this thread, can you enable these below configs in your prj.conf of your project, compile, flash and rerun your firmware to get more logs on the hardfault?

    CONFIG_THREAD_ANALYZER=y
    CONFIG_THREAD_NAME=y
    CONFIG_THREAD_MONITOR=y
    CONFIG_DEBUG_OPTIMIZATIONS=y

  • Logs below:

    *** Booting nRF Connect SDK v3.5.99-ncs1-1 ***
    [00:01:12.815,765] <inf> nrfx_sample: nrfx_gpiote sample on nrf52840dk_nrf52840
    [00:01:12.815,826] <inf> nrfx_sample: nrfx_gpiote initialized
    [00:01:12.815,826] <inf> nrfx_sample: (D)PPI configured, leaving main()
    [00:01:28.113,189] <inf> nrfx_sample: GPIO input event callback
    [00:01:28.113,220] <err> os: ***** HARD FAULT *****
    [00:01:28.113,220] <err> os: Debug event
    [00:01:28.113,250] <err> os: r0/a1: 0x00000000 r1/a2: 0x00000000 r2/a3: 0x40011000
    [00:01:28.113,250] <err> os: r3/a4: 0x0000773f r12/ip: 0x00000001 r14/lr: 0x00008221
    [00:01:28.113,250] <err> os: xpsr: 0x21000016
    [00:01:28.113,281] <err> os: Faulting instruction address (r15/pc): 0x0000065c
    [00:01:28.113,311] <err> os: >>> ZEPHYR FATAL ERROR 0: CPU exception on CPU 0
    [00:01:28.113,311] <err> os: Fault during interrupt handling

    [00:01:28.113,342] <err> os: Current thread: 0x20000720 (idle)
    �*** Booting nRF Connect SDK v3.5.99-ncs1-1 *** system
    [00:00:00.252,075] <inf> nrfx_sample: nrfx_gpiote sample on nrf52840dk_nrf52840
    [00:00:00.252,136] <inf> nrfx_sample: nrfx_gpiote initialized
    [00:00:00.252,136] <inf> nrfx_sample: (D)PPI configured, leaving main()

    To avoid confusion I am using the sample app nrfx at c:\ncs\v2.6.1\zephyr\samples\boards\nrf\nrfx\

    :/mnt/c/ncs/v2.6.1/zephyr/samples/boards/nrf/nrfx/build/zephyr$ addr2line -e zephyr.elf 0x0000065c
    C:\ncs\v2.6.1\zephyr\samples\boards\nrf\nrfx\build/C:/ncs/v2.6.1/zephyr/samples/boards/nrf/nrfx/src/main.c:38

    Do i need any other config  to get this non-halting debugging working ?

    screen shot of the prj.conf along with error

  • The issue seen only when breakpoint is set in IRQ handlers?

    Also same issue is seen with halt debugging also

    Is there any limitation  to out breakpoint in IRQ handler with Segger debugger?

    Any remedy ?

  • Hello,

    Yes, there can be issues when setting a breakpoint inside an IRQ handler or during haltmode debugging. This has been discussed in this forum before, and I guess this is not a limitation of the segger debugger but rather the nature of the interrupt handler and debugging in halt mode. Take a look at this old threadThis thread is also discussing something very similar.

    Kind Regards,

    Abhijith

Related