What should I pay attention to before using the Angle estimation algorithm?

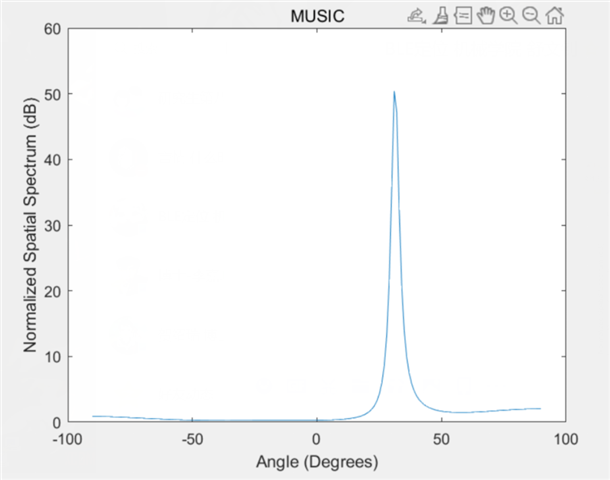
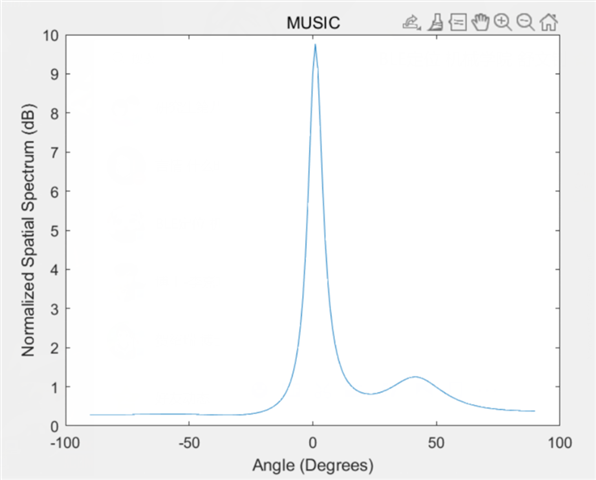
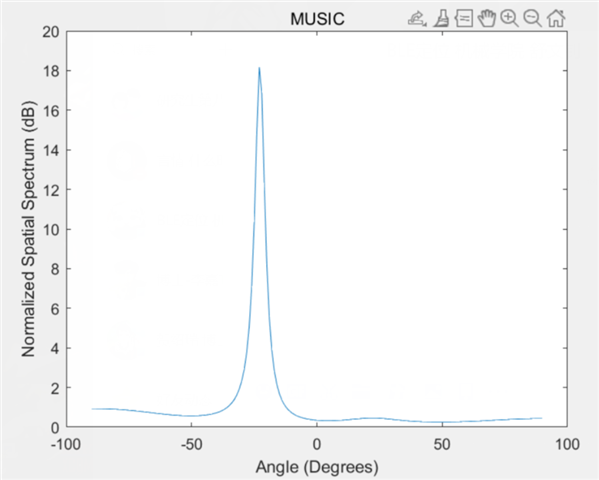
I am using the nRF52833 DK and a Nordic-designed antenna array (12 antennas with 0.02m spacing) for an AoA Direction Finding project. I obtained the IQ data using Direction finding connectionless beacon / Direction finding connectionless locator and input them into an implementation of the MUSIC algorithm, but the resulting spatial spectrum appear to be random and irregular.

Therefore, I want to verify if the IQ data I have collected is valid and usable.

I am using the default settings, with a switch slot of 2us, resulting in a sampling interval of 4us. I have removed the first 8 samples when estimating the AoA spectrum.

My IQ data was collected in an open, sparsely populated square with minimal signal interference.

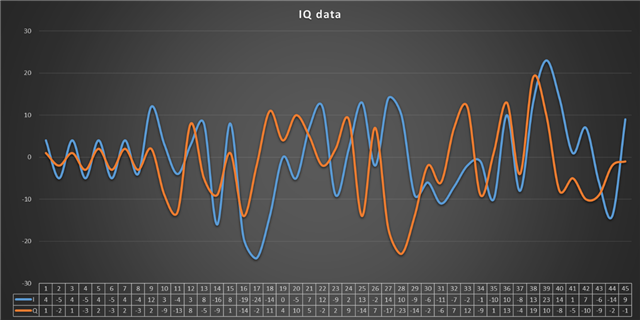
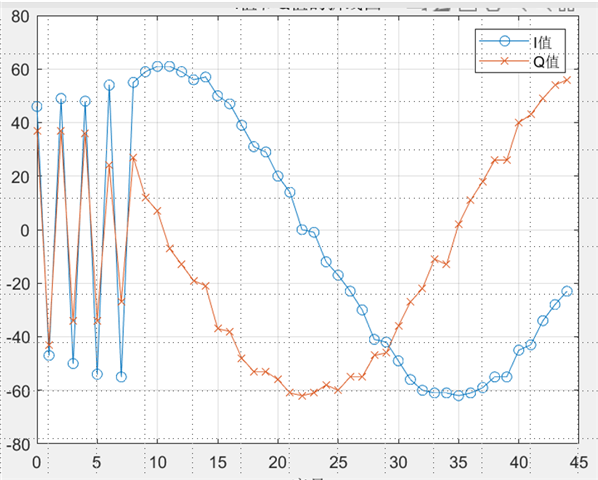
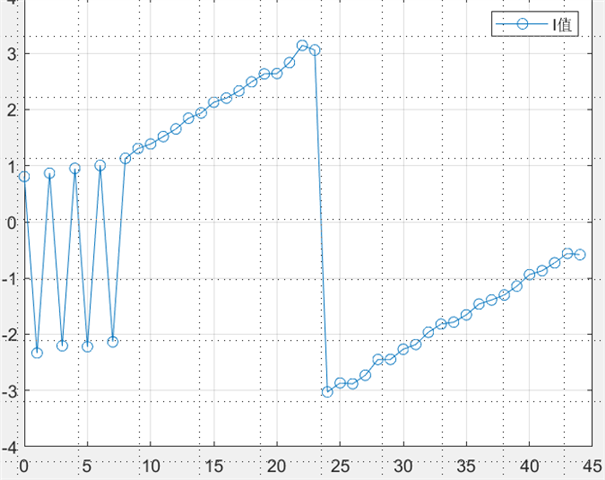
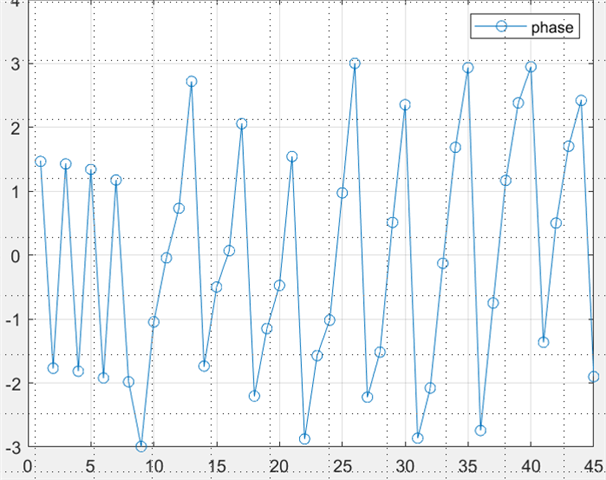
The IQ data and corresponding phase collected using a single antenna are as follows:(I'm sorry for the mistake. The legend on the right should be phase instead of I Value.)

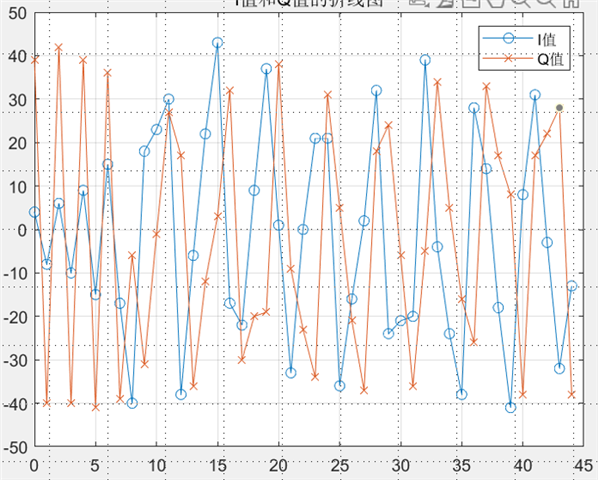
The IQ data and corresponding phase collected using a 4-antenna array are as follows:

My questions are,

1) Firstly, is there any apparent issue with the IQ data I have collected?

2) According to the whitepaper, the CTE is a 250kHz single tone signal, and my sampling interval is 4us. Thus, the additional phase difference caused by antenna switching is 2πfΔt = 2π * 2.5e5 * 4e-6 = 2π, which is exactly one period. Therefore, based on my understanding, the IQs plot and phases corresponding to the same antenna should be straight lines (please correct me if I am wrong). However, the phases I have collected are continuously changing. This could be due to errors introduced by environmental factors such as temperature and humidity. So, before AoA estimation, should I compensate for these errors? For example, should I first collect a segment of the signal to calculate the average fluctuations in IQ (ΔI and ΔQ) and then use these values to align the subsequent samples to the first sample for AoA spectrum estimation?

3) I also tried concatenating different CTE packets to increase the number of samples, but the results were still very irregular. Is it reasonable to concatenate the IQ data from multiple CTEs for direction finding?

I appreciate any reply, thanks!

Parents
  • Hi

    Unfortunately supporting the MUSIC algorithm is outside the scope from our side, so it's limited how much we can help you here I'm afraid, but you are right, the graph should be similar to what you see with one antenna, so something seems to be wrong here. I can't comment on how you've handled the IQ data, as we don't focus on that, but how have you set up the antenna switching? What antenna array are you using here and what antenna switching pattern is used here?

    Best regards,

    Simon

  • Hello, thank you for your reply.
    Yes, I understand that MUSIC is beyond your scope, so the main purpose of this case is to confirm that there is nothing wrong with the IQ data I got.
    I don't quite understand what you said about "the graph should be similar to what you see with one antenna". Are you saying "The graph should look like a straight line"?
    I used a square antenna array designed by Nordic with 12 antennas. I only use a linear array of four of these antennas. My ant_patterns[] = {0x2, 0x0, 0x5, 0x6}, which correspond to a line on the array.

  • So the single antenna plot shows that you have a frequency that is not 250KHz, as a 250KHz would yield a horisontal line for the reference period. This is to be expected as I stated, the TYPICAL value is 250KHz but it will always be a bit off.

    Then for the non-reference period you have a fairly straight line, a little bit of overlayd noise, also to be expected. The slope of this line is also coming from the non-perfect 250KHz so as indicated by the reference period.

    When you start changing the antennas as you have done, then the phase will jump for each antenna change. How much will depend on the distance between the antennas, the distance from the transmitter to the antenna array and the position relative to the antenna array. How much the phase will change is something you can model with normal trigonometry.

    You will have to use the reference phase to set the baseline for the signal, if not you will not be able to calculate any angles at all. How to do this is outside the scope of what Nordic will support as it is part of the algorithm work.

Reply
  • So the single antenna plot shows that you have a frequency that is not 250KHz, as a 250KHz would yield a horisontal line for the reference period. This is to be expected as I stated, the TYPICAL value is 250KHz but it will always be a bit off.

    Then for the non-reference period you have a fairly straight line, a little bit of overlayd noise, also to be expected. The slope of this line is also coming from the non-perfect 250KHz so as indicated by the reference period.

    When you start changing the antennas as you have done, then the phase will jump for each antenna change. How much will depend on the distance between the antennas, the distance from the transmitter to the antenna array and the position relative to the antenna array. How much the phase will change is something you can model with normal trigonometry.

    You will have to use the reference phase to set the baseline for the signal, if not you will not be able to calculate any angles at all. How to do this is outside the scope of what Nordic will support as it is part of the algorithm work.

Children
Related