NUS Central Write To Peripheral RX Characteristic Very Slow

Hello!

I am currently running into throughput problems while using the Nordic Uart Service (NUS).

I am building a project for a peripheral and wanted to test the possible throughput by using the central_uart example. I modified this example slightly in order to add updates for BLE connection parameters as well as Data Length. I have callbacks for these connection parameters in both my peripheral project as well as in the central project and also added the needed CONFIG_XXX parameters to the respective prj.conf files. After connection, both devices show the following log, so I assume this has worked correctly:

<inf> BLE: MTU exchange successful
<inf> BLE: New MTU: 244 bytes
<inf> BLE: Data length updated. Length 251/251 bytes, time 2120/2120 us
<inf> BLE: Connection parameters updated. interval 320, latency 0, timeout 400

I chose these parameters after trying the BLE Throughput example. With this Throughput example, the config listed as above and 1M PHY, I have a data rate of 783 kbps, which is great.

However, if I try to send BLE messages of 244 bytes with my Central/Peripheral setup, I encounter the following problem:

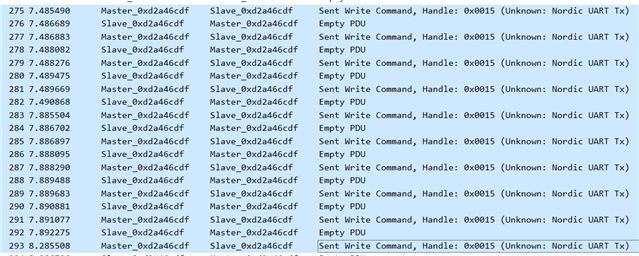
Calling bt_nus_client_send() on the client side, which in turn calls bt_gatt_write() and  waits for the passed callback function, there is a large delay of ~800msecs between the call of the write function and the execution of the callback function. This slows down the data rate to an unusable 330 bytes/sec..

On the peripheral side I just have my bt_nus_cb receive callback, where I only copy the received data. This should not be a performance limiting factor in my mind.

I know that the Throughput example uses bt_gatt_write_withous_response() while the nus_client uses bt_gatt_write() which, if I'm correct, has an acknowledge in the link layer included. But I don't think that this would cause this huge delay...

So my question is: am I missing something here? Do you have any suggestions as to what I need to change in order to increase the data rate? The throughput example shows me that it should be possible, so I guess with the NUS service it should be possible as well..?

Any help is appreciated!

Parents
  • Haven't tried those configurations myself, but you can try SystemView and get a better idea on the context where that ~800ms delay (wait) is happening. After getting the context of that delay, we would have more info to calibrate on reducing that delay. SystemView is free to try on Nordic products, so please give it a try.

  • Hello again,

    I changed some things around that I'd like to let you know:

    • within the central_uart.c main() function, bt_nus_client_send() is called
    • this function in turn (within nus_client.c) calls bt_gatt_write() (which than again should promt the callback that causes the above mentioned delay)
    • I now changed the bt_gatt_write() to bt_gatt_write_without_response(), as this is used withing the Throughput example.

    Now, within the main() of central_uart.c I call the bt_nus_client_send() in a loop like so:

    int main(void)
    {
        // ...
        // INITIALIZATIONS
        // ...
    
    	for (int i = 0; i < 10; i++) 
    	{
    		uint8_t pucBuf[UART_BUF_SIZE] = 
    		{
    			// DUMMY DATA; e.g.:
    			0x00, 0x01, 0x02, 0x03
    		};
    
    		LOG_DBG("Sending data block no %d", i + 1);
    
    		err = bt_nus_client_send(&nus_client, pucBuf, sizeof(pucBuf));
    		if (err) 
    		{
    			LOG_WRN("Failed to send data over BLE connection"
    				"(err %d)", err);
    		}
    	}
    }

    with the changed bt_nus_client_send() in nus_client.c

    int bt_nus_client_send(struct bt_nus_client *nus_c, const uint8_t *data,
    		       uint16_t len)
    {
    	int err;
    
    	if (!nus_c->conn) {
    		return -ENOTCONN;
    	}
        
        // COMMENT THIS OUT IN ORDER TO RUN THIS SEND FUNCTION MULTIPLE TIMES
    	// LOG_INF("Trying to set atomic bit for NUS_C_RX_WRITE_PENDING");
    	// if (atomic_test_and_set_bit(&nus_c->state, NUS_C_RX_WRITE_PENDING)) {
    	// 	return -EALREADY;
    	// }
    	// LOG_INF("Atomic Bit set for NUS_C_RX_WRITE_PENDING, value: %d", atomic_test_bit(&nus_c->state, NUS_C_RX_WRITE_PENDING));
    
    	nus_c->rx_write_params.func = on_sent;
    	nus_c->rx_write_params.handle = nus_c->handles.rx;
    	nus_c->rx_write_params.offset = 0;
    	nus_c->rx_write_params.data = data;
    	nus_c->rx_write_params.length = len;
    
        // INITIALLY THIS BLOCK IS CALLED
    	// err = bt_gatt_write(nus_c->conn, &nus_c->rx_write_params);
    	// if (err) {
    	// 	atomic_clear_bit(&nus_c->state, NUS_C_RX_WRITE_PENDING);
    	// }
    
        // --> CHANGED THIS TO TEST THROUGHPUT INCREASE
    	err = bt_gatt_write_without_response(nus_c->conn, nus_c->handles.rx, data, len, false);
    
    
    	return err;
    }

    Simple stuff basically, no delay or sleep or anything. However, in the LOG output I notice that the sending is happening in some kind of time chunks, as you can see here:

    [00:00:11.731,994] <dbg> central_uart: main: Sending data block no 1
    [00:00:11.732,635] <dbg> central_uart: main: Sending data block no 2
    [00:00:11.733,276] <dbg> central_uart: main: Sending data block no 3
    [00:00:11.733,947] <dbg> central_uart: main: Sending data block no 4
    [00:00:11.984,008] <dbg> central_uart: main: Sending data block no 5
    [00:00:11.985,565] <dbg> central_uart: main: Sending data block no 6
    [00:00:11.987,213] <dbg> central_uart: main: Sending data block no 7
    [00:00:11.987,854] <dbg> central_uart: main: Sending data block no 8
    [00:00:12.384,002] <dbg> central_uart: main: Sending data block no 9
    [00:00:12.385,559] <dbg> central_uart: main: Sending data block no 10

    Between Blocks 4/5 and 8/9, there is again a delay of 250/400ms respectively.

    Now I don't really understand why this is happening. Shouldn't bt_gatt_write_without_response() send out the data as fast as possible? What is the cause of the delay here?

  • Hello DB_ECD,

    I am very sorry for the delay. 

    The sniffer log show that the transfer was done over three connection events. 4 chunks in the first connection event at t~=7.49; 5 chunks in the next event, and 1 chunk in the last one. So overall, it matches up with your observation of that the transmission took 800ms.

    It mismatches with the log a little, where the chunks are sent in a 4-4-2 spread. Do the log and the sniffer come from the same test? 

    This is a little important because I think this might be Connection Event Length Extension at work, where the SoftDevice Controller increase the Connection Event Length if there are more data to send, but only by one TX-RX pair at a time. See Scheduling (nordicsemi.com).

    The 4-5-1 spread matches that behavior, but the 4-4-2 one doesn't.

    Do you mind repeating this experiment with more chunks?

    Also, it might be a little helpful with reading the sniffer log to add some manner of ASCII counter in the payload.

  • P.s: You can also try increasing CONFIG_BT_CTLR_SDC_MAX_CONN_EVENT_LEN_DEFAULT. It is probably a good idea to increase it by just a little bit to experimentally verify it is working first.

  • Thanks for your reply and sorry for my delay as well, I was on a short vacation the last week.

    The log and Sniffer did come from the same test.

    I ran the test again, this time using 20 packets (where the first byte of every packet is used as a package counter), the data of which you'll find here:

    5340.2024-07-10_DataRateTest2.zip

    Here, I encountered basically all the same things as before:

    • on the peripheral side: a 4-4-4-5-3 spread
      (as seen in the Log_peripheral, Uart_peripheral and sniffer-pcap files)
    • on the central side: a 4-4-4-4-4 spread
      (as seen in the Log_central file)
    P.s: You can also try increasing CONFIG_BT_CTLR_SDC_MAX_CONN_EVENT_LEN_DEFAULT. It is probably a good idea to increase it by just a little bit to experimentally verify it is working first.

    I actually already did that on the central side, increasing this number to the maximum value of 4.000.000. This was used in the test above as well. Changing this value did not seem to improve/worsen the result.

    I have to admit that I am kind of lost here.

    PS: here are the prj.conf files for peripheral and central, if you need them.

    prj_configs.zip

  • I notice some of your configuration differs from that in the Throughput sample. The buffer related ones could explain the issue. Could you please add these configurations and retry?

    CONFIG_BT_USER_DATA_LEN_UPDATE=y
    CONFIG_BT_USER_PHY_UPDATE=y
    CONFIG_BT_GAP_AUTO_UPDATE_CONN_PARAMS=n
    
    CONFIG_BT_BUF_ACL_RX_SIZE=502
    CONFIG_BT_ATT_PREPARE_COUNT=2
    CONFIG_BT_L2CAP_TX_BUF_COUNT=10
    CONFIG_BT_L2CAP_TX_MTU=498
    CONFIG_BT_L2CAP_DYNAMIC_CHANNEL=y
    CONFIG_BT_CONN_TX_MAX=10
    CONFIG_BT_BUF_ACL_TX_COUNT=10
    CONFIG_BT_BUF_ACL_TX_SIZE=502
    
    CONFIG_BT_CTLR_DATA_LENGTH_MAX=251
    CONFIG_BT_CTLR_PHY_2M=y
    CONFIG_BT_CTLR_PHY_CODED=y
    CONFIG_BT_CTLR_SDC_MAX_CONN_EVENT_LEN_DEFAULT=4000000

  • Hello Hieu,

    I tried these config values at the very beginning already. I just comiled it again using these values, but it did not significantly improve the result.

    However, I kept changing and trying different things and found out that the connection interval value has a huge impact on the througput rate (as to be expected tbh). 

    How is this working exactly? Are all the messages as configured in the buffer related configuration values processed and buffered and then sent all at once on every connection event, i.e. channel hop?

    As a related question: is there a downside besides increased currend consumption to reducing the connection interval time to a small value of a few ms?

    I believe that it's really coming down to chosing just the right connection as well as configuration parameters. If there just weren't so many possibilities.. Anyway, thanks again for all your help so far!

Reply
  • Hello Hieu,

    I tried these config values at the very beginning already. I just comiled it again using these values, but it did not significantly improve the result.

    However, I kept changing and trying different things and found out that the connection interval value has a huge impact on the througput rate (as to be expected tbh). 

    How is this working exactly? Are all the messages as configured in the buffer related configuration values processed and buffered and then sent all at once on every connection event, i.e. channel hop?

    As a related question: is there a downside besides increased currend consumption to reducing the connection interval time to a small value of a few ms?

    I believe that it's really coming down to chosing just the right connection as well as configuration parameters. If there just weren't so many possibilities.. Anyway, thanks again for all your help so far!

Children
No Data
Related