Power Profiler + PPK2 slow on version 4.1

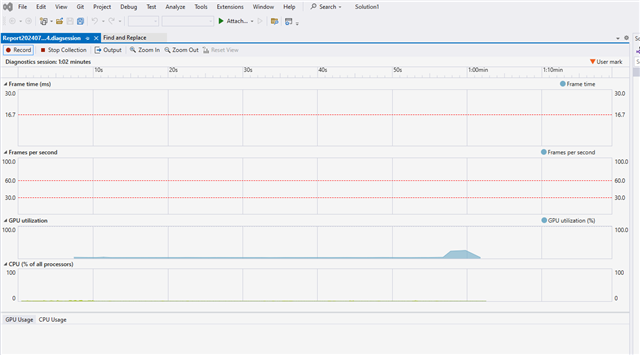
Hi. I'm on a relatively old ryzen-5 windows 11 PC and I get 30 FPS when recording power with Power Profiler version 4.0.0 and 2 FPS when recording with newer versions (4.1.<0,1,2>)
Don't really know what to do except keep the old version.

Parents
  • Hi Jason,

    Are you using Windows 11 as well?

    Regards,

    Swathy

  • no, windows10.

    It's fine when I roll back to 4.0.0. 

  • I see these processes

    nRF Connect for Desktop.exe, 19:14:28 08/07/2024, 34528, 0.70, 3.91 MB/s, 247.77 MB, 257.49 MB, 3.11 TB, 3.11 TB, , 00:00:40.734, nRF Connect for Desktop, 253.66 MB, 261.82 MB, 180.68 MB, 196,321, Normal, 431, 1, 00:00:04.171, 4,705, 635 kB, 638.88 kB, 27.32 kB, 29.1 kB, "C:\Users\Jason\AppData\Local\Programs\nrfconnect\nRF Connect for Desktop.exe" --type=renderer --user-data-dir="C:\Users\Jason\AppData\Roaming\nrfconnect" --app-path="C:\Users\Jason\AppData\Local\Programs\nrfconnect\resources\app.asar" --no-sandbox --no-zygote --lang=en-GB --device-scale-factor=1 --num-raster-threads=4 --enable-main-frame-before-activation --renderer-client-id=10 --time-ticks-at-unix-epoch=-1719596320366786 --launch-time-ticks=862548614418 --field-trial-handle=4784,i,16843214917669530232,2227972334951459283,262144 --enable-features=kWebSQLAccess --disable-features=SpareRendererForSitePerProcess,WinDelaySpellcheckServiceInit,WinRetrieveSuggestionsOnlyOnDemand --variations-seed-version --mojo-platform-channel-handle=3868 /prefetch:1, 22:15:38 24/04/2024, 00:00:36.562

    and


    nRF Connect for Desktop.exe, 14:28:57 08/07/2024, 70092, 0.69, 2.77 MB/s, 126.66 MB, 89 MB, 2.04 TB, 2.04 TB, , 00:08:56.625, nRF Connect for Desktop, 269.27 MB, 152.89 MB, 27.56 MB, 6,898,573, Above normal, 625, 16, 00:01:47.500, 14,337, 890.32 kB, 939.68 kB, 34.09 kB, 37.6 kB, "C:\Users\Jason\AppData\Local\Programs\nrfconnect\nRF Connect for Desktop.exe" --type=gpu-process --user-data-dir="C:\Users\Jason\AppData\Roaming\nrfconnect" --gpu-preferences=WAAAAAAAAADgAAAMAAAAAAAAAAAAAAAAAABgAAEAAAA4AAAAAAAAAAAAAAAEAAAAAAAAAAAAAAAAAAAAAAAAAAAAAAAAAAAAGAAAAAAAAAAYAAAAAAAAAAgAAAAAAAAACAAAAAAAAAAIAAAAAAAAAA== --field-trial-handle=1796,i,16843214917669530232,2227972334951459283,262144 --enable-features=kWebSQLAccess --disable-features=SpareRendererForSitePerProcess,WinDelaySpellcheckServiceInit,WinRetrieveSuggestionsOnlyOnDemand --variations-seed-version --mojo-platform-channel-handle=1788 /prefetch:2, 22:15:38 24/04/2024, 00:07:09.125

    Almost no GPU usage

    or CPU usage 

    RAM and IO etc look normal. 

    I ran a VS2022 performance diagnositc and I've attached the file. Maybe a developer can load it. There's no symbols unfortunately. 

    The fact that it shows less than 1% CPU or GPU suggests its waiting for something, or it's in a system call.  That's my guess at least

    Report20240708-1924.zip

Reply Children
No Data
Related