
Hello, I am developing on a custom board with the nrf5340 and programming through SWD using the nrf5340dk. A few days ago everything was running fine and I was able to continuously test and debug my application code for my board. However, yesterday during mid development, I started receiving these errors:
[error] [ Client] - Encountered error -90: Command read_memory_descriptors executed for 2 milliseconds with result -90
[error] [ Worker] - Can't read memory descriptors, ap-protection is enabled.
[error] [ Client] - Encountered error -90: Command erase_file executed for 123 milliseconds with result -90
[error] [  nRF53] - Failed while detecting device memory block protection status!
[error] [  nRF53] - Failed while erasing device. -90: Access protection is enabled, can't read block protection state.
[error] [ Worker] - Access protection is enabled, can't read block protection state.
ERROR: The operation attempted is unavailable due to readback protection in
ERROR: your device. Please use --recover to unlock the device.
NOTE: For additional output, try running again with logging enabled (--log).
NOTE: Any generated log error messages will be displayed.
ERROR: runners.nrfjprog: Flashing failed because the target must be recovered.
  To fix, run "west flash --recover" instead.
  Note: your target is an nRF53; all flash memory for both the network and application cores will be erased prior to reflashing.
No matter what I tried, I could not flash my multi-image build as it would always fail when programming the network core. I did a lot of reading on devzone of other tickets with the same problem and tried many things to make it work. I reached a point where i'm able to go through a process in order to successfully flash both cores:
- Open the nrfprogrammer desktop app and erase all to start the chip fresh
- Then I go to the nrf connect terminal and run: nrfjprog --coprocessor CP_APPLICATION --recover. (Note. I also tried using just --recover. It recovers both cores but the error persists when it reaches the network core stage so I only recover the application core and both cores are able to flash)
- After I recover the application core, both cores are able to flash.
There is still a catch though. This process only works when I'm programming using non_secure (nrf5340_cpuapp_ns) . When trying using regular (nrf5340_cpuapp) this does not work at all and it fails when programming the network core no matter what with the same ap protect error.
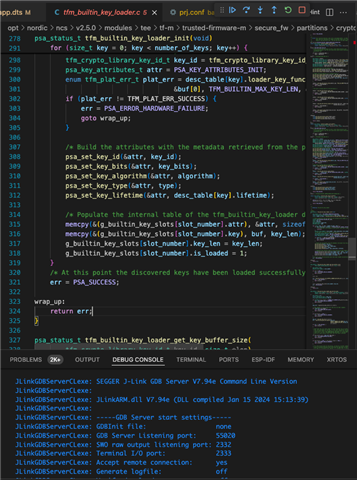
But even after all this and when both cores are flashed using non secure and the method above, I am unable to debug and my application code does not run any more. Nothing appears on the RTT viewer and when I open debug I get this error with the Trusted Firmware-M:
JLinkGDBServerCLexe: SEGGER J-Link GDB Server V7.94e Command Line Version
JLinkGDBServerCLexe:
JLinkGDBServerCLexe: JLinkARM.dll V7.94e (DLL compiled Jan 15 2024 15:13:39)
JLinkGDBServerCLexe:
JLinkGDBServerCLexe: -----GDB Server start settings-----
JLinkGDBServerCLexe: GDBInit file:                  none
JLinkGDBServerCLexe: GDB Server Listening port:     55020
JLinkGDBServerCLexe: SWO raw output listening port: 2332
JLinkGDBServerCLexe: Terminal I/O port:             2333
JLinkGDBServerCLexe: Accept remote connection:      yes
JLinkGDBServerCLexe: Generate logfile:              off
JLinkGDBServerCLexe: Verify download:               off
JLinkGDBServerCLexe: Init regs on start:            off
JLinkGDBServerCLexe: Silent mode:                   on
JLinkGDBServerCLexe: Single run mode:               on
JLinkGDBServerCLexe: Target connection timeout:     0 ms
JLinkGDBServerCLexe: ------J-Link related settings------
JLinkGDBServerCLexe: J-Link Host interface:         USB
JLinkGDBServerCLexe: J-Link script:                 none
JLinkGDBServerCLexe: J-Link settings file:          none
JLinkGDBServerCLexe: ------Target related settings------
JLinkGDBServerCLexe: Target device:                 nRF5340_xxAA_APP
JLinkGDBServerCLexe: Target device parameters:      none
JLinkGDBServerCLexe: Target interface:              SWD
JLinkGDBServerCLexe: Target interface speed:        12000kHz
JLinkGDBServerCLexe: Target endian:                 little
JLinkGDBServerCLexe:
=thread-group-added,id="i1"
=cmd-param-changed,param="pagination",value="off"
0x000007b6 in tfm_builtin_key_loader_init () at /opt/nordic/ncs/v2.5.0/modules/tee/tf-m/trusted-firmware-m/secure_fw/partitions/crypto/psa_driver_api/tfm_builtin_key_loader.c:325
325	}
Here is an image. Normally. the debug would boot into the application but it stops short here and clicking resume results in an indefinite hang
Please note I was actively developing on this just fine so the issue is not likely to be my custom board. I have tried other solutions such as the external oscillator setup which I had already setup a while ago, I upgraded and downgraded the nrfconnect-command-line tools to multiple different versions and installed and reinstalled everything in the nrfconnect vscode multiple times. I did not modify anything in my board files. They are identical to when I was developing on the custom board with no issues a few days ago. I did not add or remove anything to my application code as well. I am using sys build and I did not modify any of my build config files other these as well.

